- Home
- Documentation
- Adaptive Governance
- Impact Analysis
Impact Analysis shows, in a graph, the dependency network of an API: who consumes the API, which resources and operations it exposes, and which backend (destination) each operation points to. It is in the Impact Analysis tab of the API details screen, in Discovery.
Use the analysis before changing, versioning, or deactivating an API. This way you see what may be affected without opening the console of each gateway.
The analysis works for APIs from Sensedia API Management and from other gateways cataloged in Adaptive Governance, such as AWS API Gateway, Apigee, and MuleSoft. The amount of information shown depends on the API origin. See What each origin shows.
NOTEImpact Analysis is no longer a standalone option in the Adaptive Governance menu. Since the analysis is always about one API, it is now inside the details screen of the API itself, in Discovery.
When to use
- Before changing or removing a resource or an operation, to see what depends on it.
- Before deactivating an API, to check whether applications and plans consume it.
- To find out which backend an operation calls, without opening the source gateway.
- To compare what is deployed in each environment of the API.
Prerequisites
- The API must be cataloged in Adaptive Governance through a native or non-native connection.
- The API must have an OpenAPI or Swagger contract. The resources and operations shown in the graph are read from this contract.
- The API must have at least one deployed revision. The analysis starts from what is deployed in each environment.
How to access
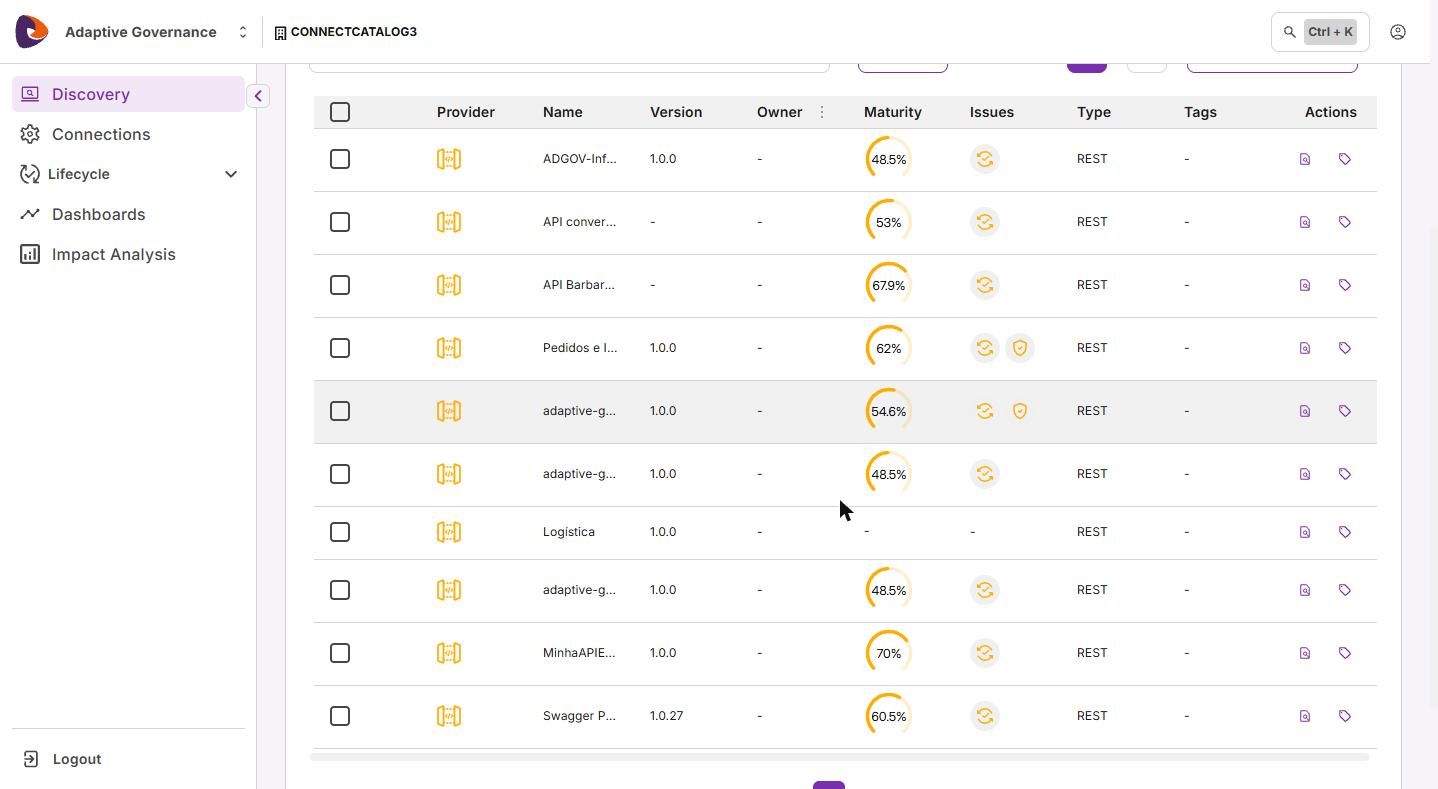
Find the API in Discovery
In the Adaptive Governance menu, click Discovery and find the API you want to analyze. If needed, use the Name field or the filters (for example, Provider) to narrow down the list.
Open the API details
In the Actions column, click the View API details icon. The Overview screen opens with the General Info, Documentation, Deployments, and Impact Analysis tabs.
Open the Impact Analysis tab
Click the Impact Analysis tab, marked with the New badge. The API graph loads already fitted to the visible area, with the API resources on the first level.
NOTEDuring a transition period, the Impact Analysis item still appears in the side menu. When you open it, a message informs that the feature was moved to the API details screen, and the Find an API in Discovery button takes you to Discovery.
How the screen is organized
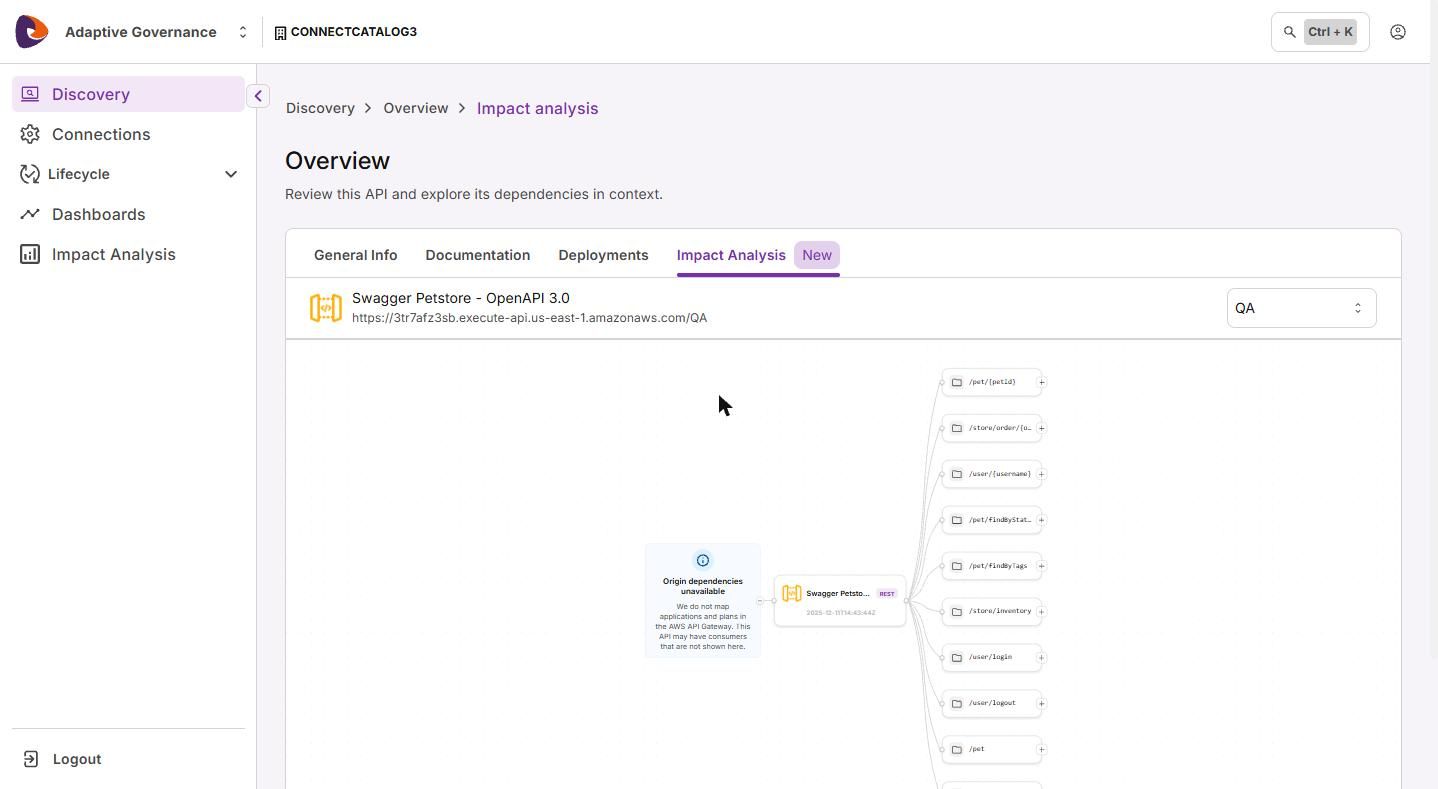
The tab has three areas:
- Context bar, at the top: shows the API name, the API exposure URL in the selected environment and, on the right, the environment selector.
- Graph, in the center: the API is in the middle, consumers are on the left, and the API structure (resources, operations, and destinations) is on the right.
- Graph controls, in the lower right corner: fit the graph to the screen, zoom out, and zoom in.
There is no API selector in the tab, because the API is the context of the screen.
Environment selector
The environment selector lists the environments where the API has a deployed revision. For AWS API Gateway APIs, for example, it lists the API stages.
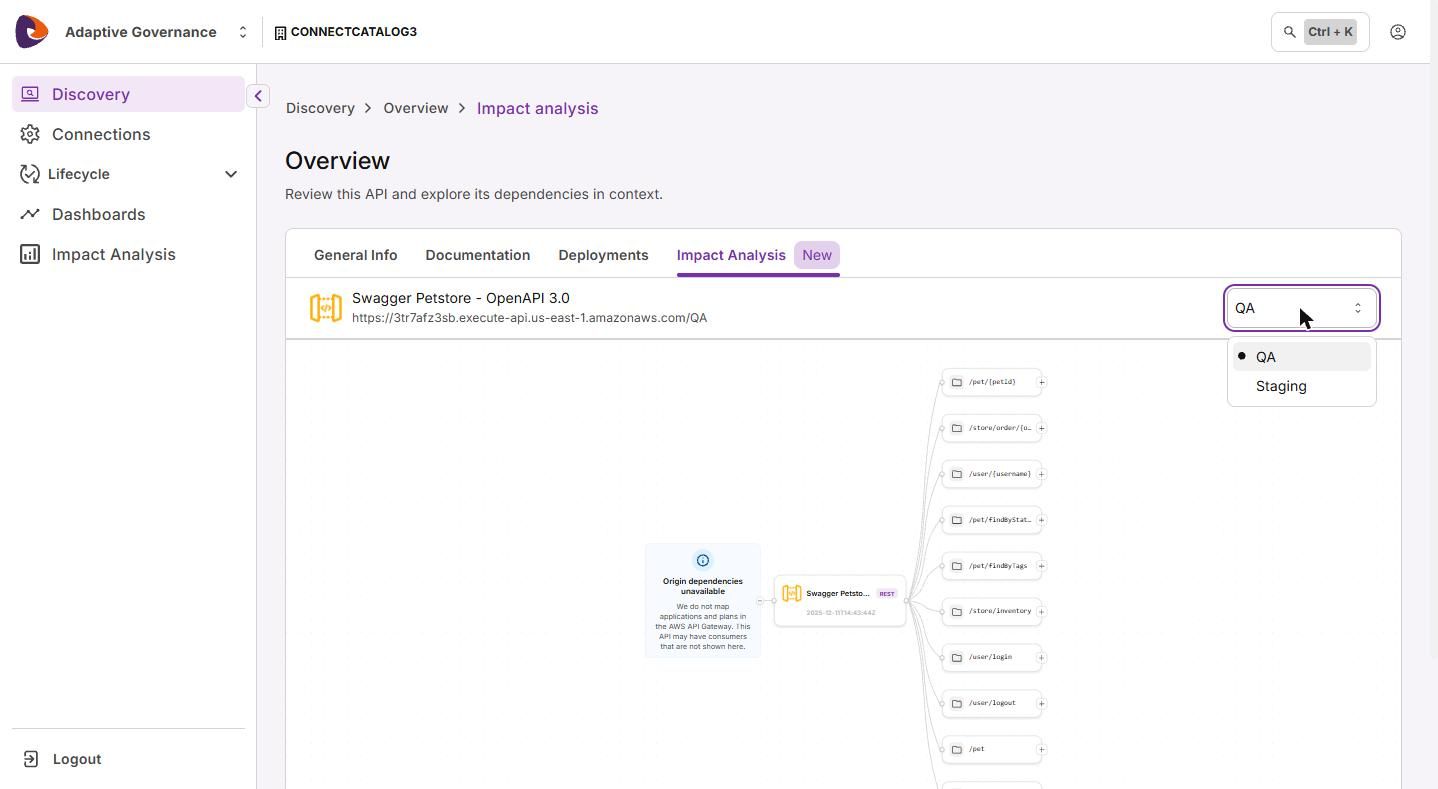
When you change the environment, the context bar shows the exposure URL of that environment and the graph reloads with the revision deployed there. If different environments have different revisions, the graph shows the revision of each environment.
API node
The central node shows the API name, the type (for example, REST) and, below the name, the identification of the revision in context.
What each origin shows
The API structure always comes from the OpenAPI or Swagger contract. The other information depends on the source gateway:
When some information does not exist for the API origin, the screen says so instead of showing an empty block.
Example: AWS API Gateway API
To show the analysis in practice, this example uses the Swagger Petstore - OpenAPI 3.0 API, imported from a connection with AWS API Gateway and deployed to the QA and Staging stages.
Open the API analysis
In Discovery, filter by Provider equal to Aws, find the Swagger Petstore - OpenAPI 3.0 API, click View API details, and open the Impact Analysis tab.
The analysis opens on the QA stage. The context bar shows the exposure URL of that stage, ending in /QA.
Change the environment
In the environment selector, choose Staging. The context bar URL now ends in /Staging and the revision identification below the API name changes, because each stage has its own deployment.
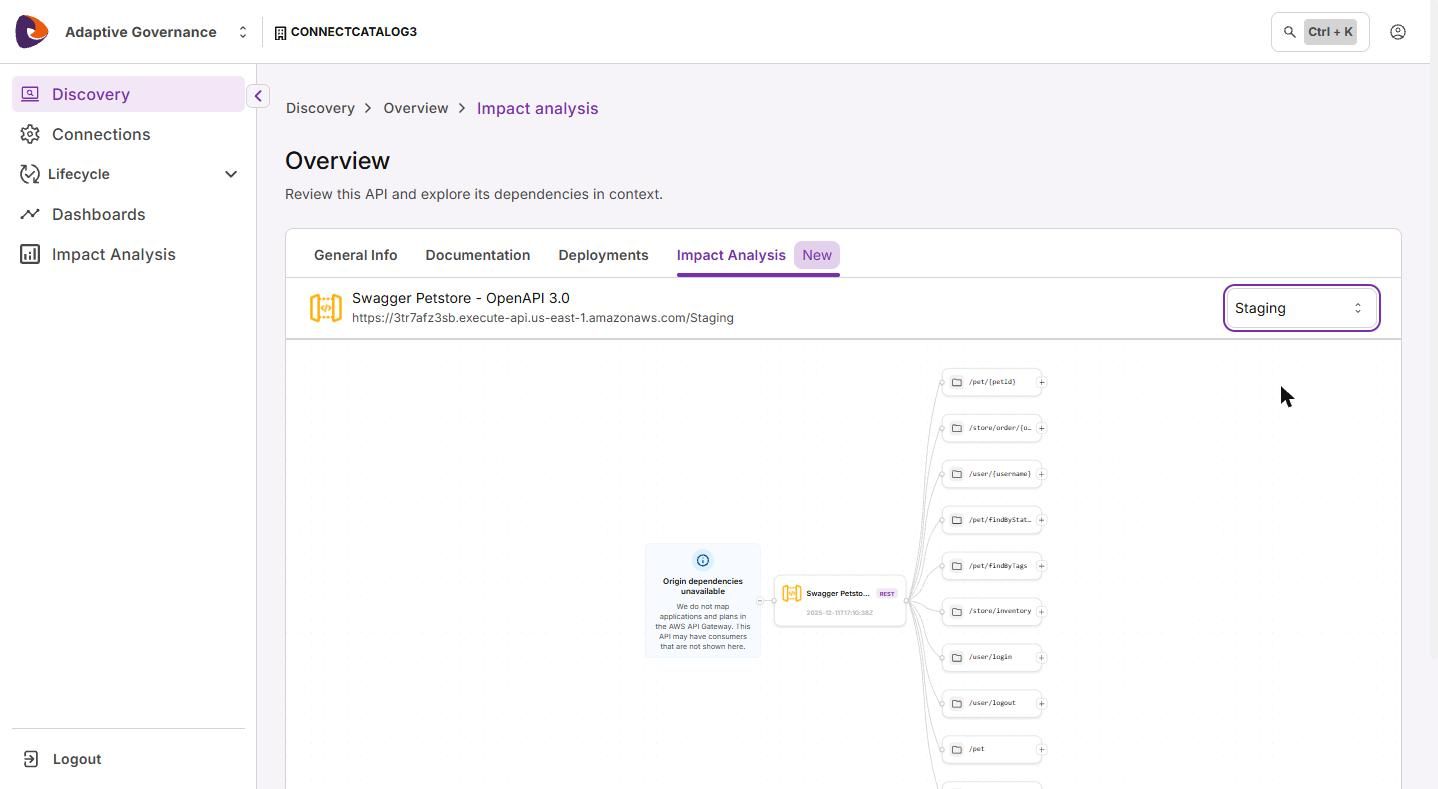
Read the consumers side
On the left of the API, the Origin dependencies unavailable block informs that applications and plans are not mapped in AWS API Gateway and that the API may have consumers that do not appear in the graph.
Expand a resource
On the right, click the + control of the /pet/{petId} resource. The graph shows the resource operations (GET, POST, and DELETE) and, next to each operation, the destination it points to.
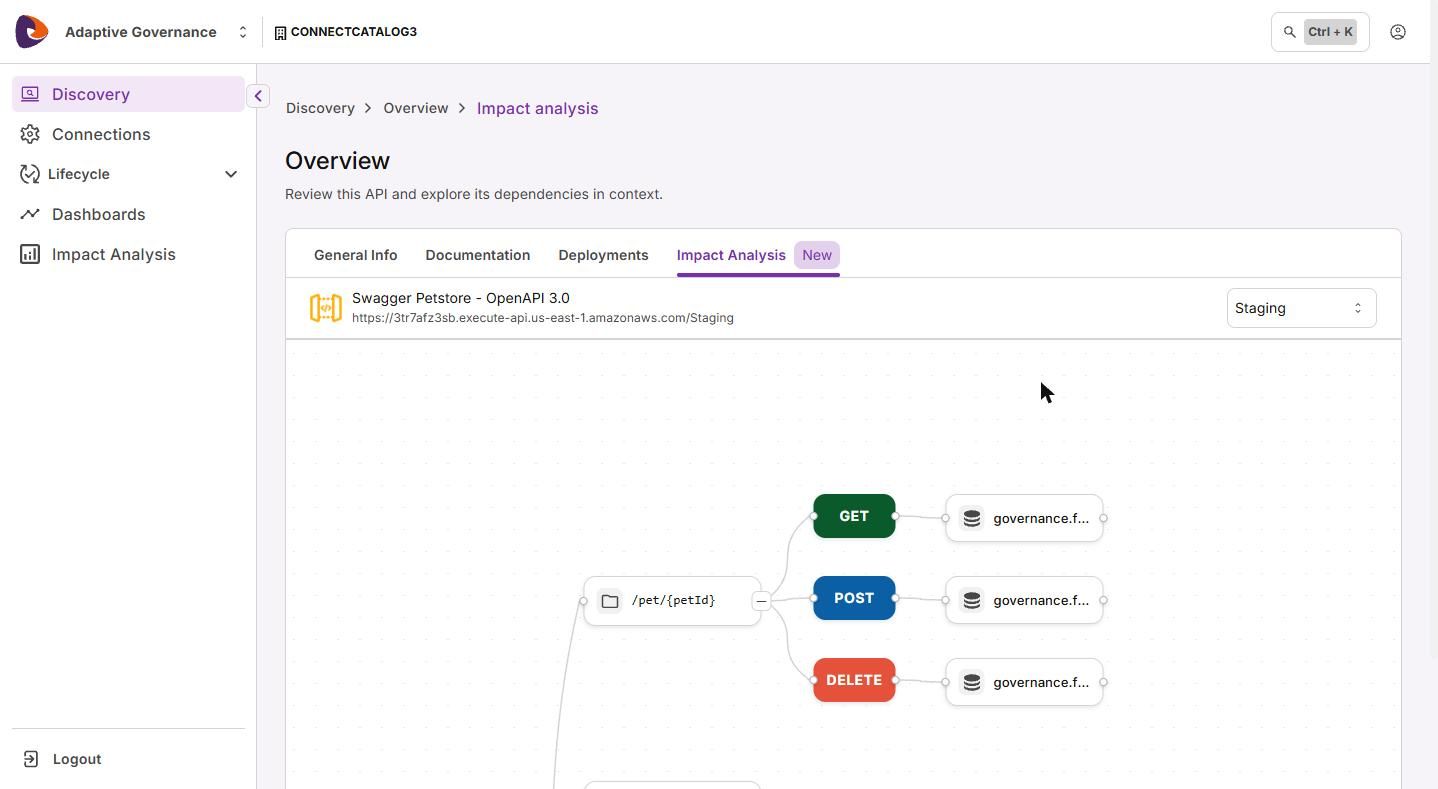
See the backend called
Click the destination of the GET operation. The side panel shows that the operation calls https://governance.free.beeceptor.com/pet/*, through an http_proxy integration with an INTERNET connection.
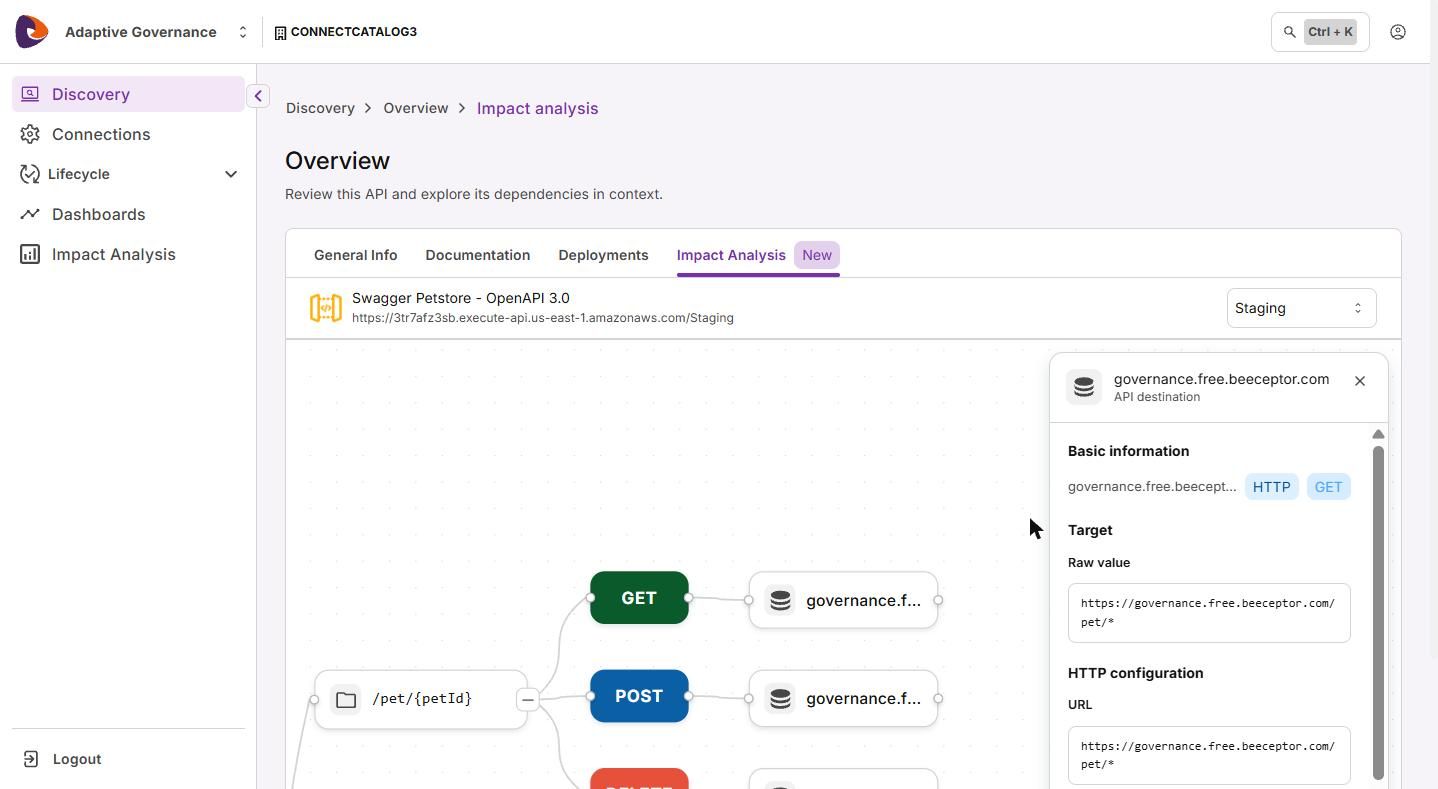
With this reading, you know which operations of the stage depend on each backend. Since the API is from AWS API Gateway, remember that consumers do not appear in the graph: confirm in the gateway who consumes the API before deactivating it.
How to explore the graph
- Click the + control of a node to expand the items below it and the − control to collapse them. Nodes with no items below do not show the control.
- When you expand a resource, the operations and their destinations are shown together.
- Click a node to select it and open the details panel. The graph is centered on the selected node.
- Use the controls in the lower right corner: Fit graph to view fits the graph to the visible area, Zoom out zooms out, and Zoom in zooms in.
Consumers
The left side of the graph shows the applications and plans that consume the API. This information exists only for Sensedia API Management APIs, and it is fetched when you open the tab, reflecting the current link between API and application.
The block shows one of these results:
WARNINGFor APIs from other gateways, the absence of consumers in the graph does not mean that nobody uses the API. Before deactivating an API from this origin, confirm the consumers in the source gateway.
Details panel
When you click a node, the Node details side panel opens with the item information, without leaving the graph. To close it, click the X. The header shows the node name and type: REST API, Resource, HTTP method, or API destination.
The content depends on the node type:
- API: under Configuration, the name (label), type (apiType), and version (version). Under Analytics, the call metrics, when available for the origin.
- Resource: under Configuration, the name (label) and path (path) of the resource.
- HTTP method (operation): under Analytics, the call metrics, when available for the origin.
- API destination: see Destination.
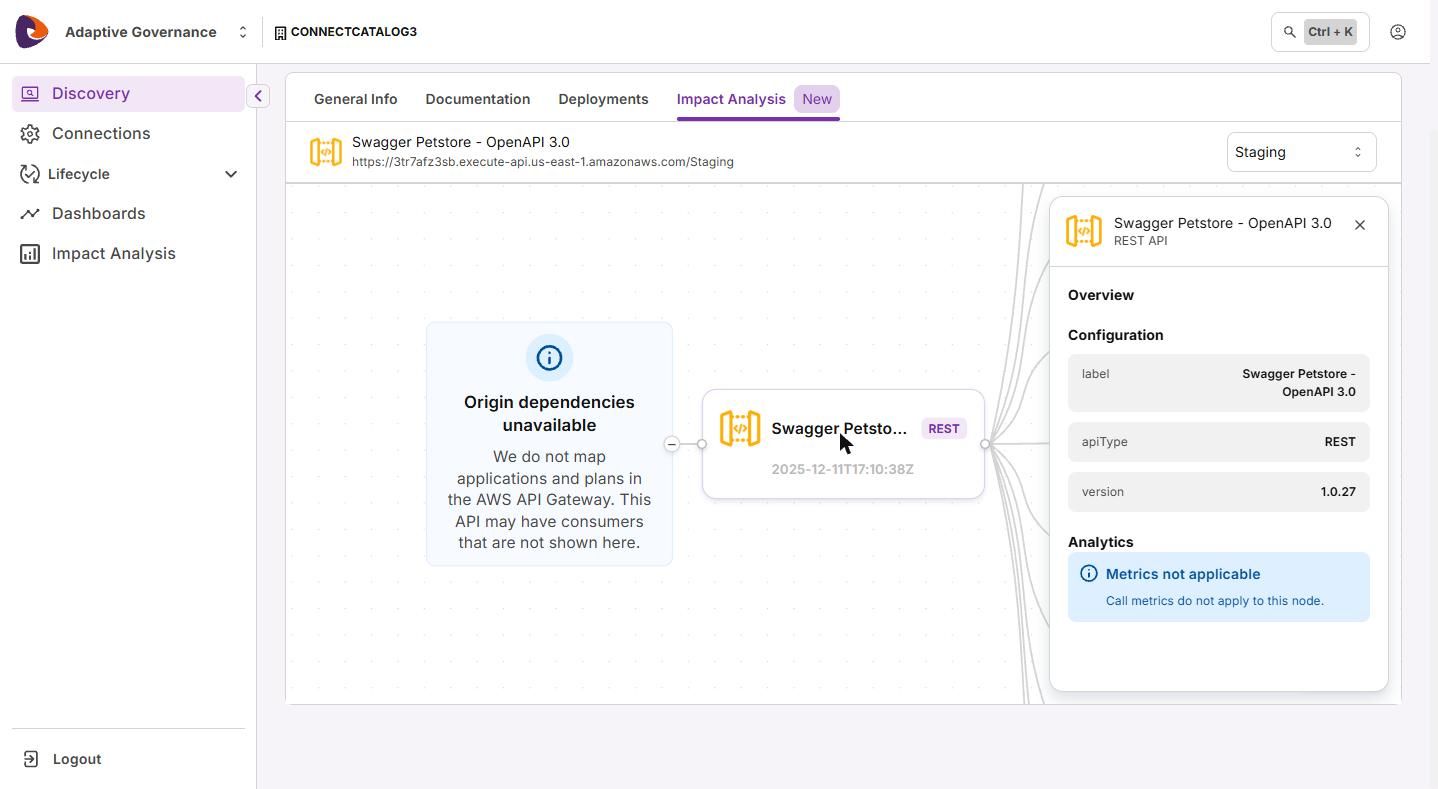
Call metrics
For Sensedia API Management APIs, the Analytics block shows the total number of calls (Calls) and the percentage distribution of responses:
- Success: 2xx responses
- Redirect: 3xx responses
- Client Errors: 4xx responses, except 413 and 429
- Server Errors: 5xx responses
- Blocked: 413 and 429 responses
The metrics refer to the current day.
For APIs from other gateways, the Analytics block shows the message Metrics not applicable, because call metrics are not yet collected for these origins.
Destination
The destination panel shows:
- Basic information: the destination name, a badge with the type (for example, HTTP), and a badge with the operation method.
- Target: the value configured in the gateway, under Raw value.
- HTTP configuration, when the destination is HTTP: URL, Integration type, and Connection type.
When the specific fields cannot be extracted from the configured value, the panel shows only the Raw value, with no blank fields.
Destinations of Sensedia API Management APIs
- Destination configured with an environment variable: the panel shows the URL resolved for the selected environment and, next to it, the name of the source variable. When you change the environment, the URL is recalculated. If the variable cannot be resolved, the panel shows the configured value and indicates that resolution was not possible.
- Destination defined in an interceptor: when an operation calls the backend through an interceptor, the graph indicates that there is a destination defined in the interceptor and shows its name. The URL of this destination is not identified.
Limitations
- The analysis requires an OpenAPI or Swagger contract. AsyncAPI contracts and events are not supported.
- Applications, plans, and call metrics are shown only for Sensedia API Management APIs.
- Destinations are shown for Sensedia API Management and AWS API Gateway APIs.
- Revisions without deployment are not analyzed.
- You cannot see several revisions or environments in the same graph. To compare, change the environment in the selector.
- The metrics window is fixed to the current day. There is no period selector.