The Logs screen lists the logs of a product in the selected period. When it opens, the period covers the last 30 minutes.
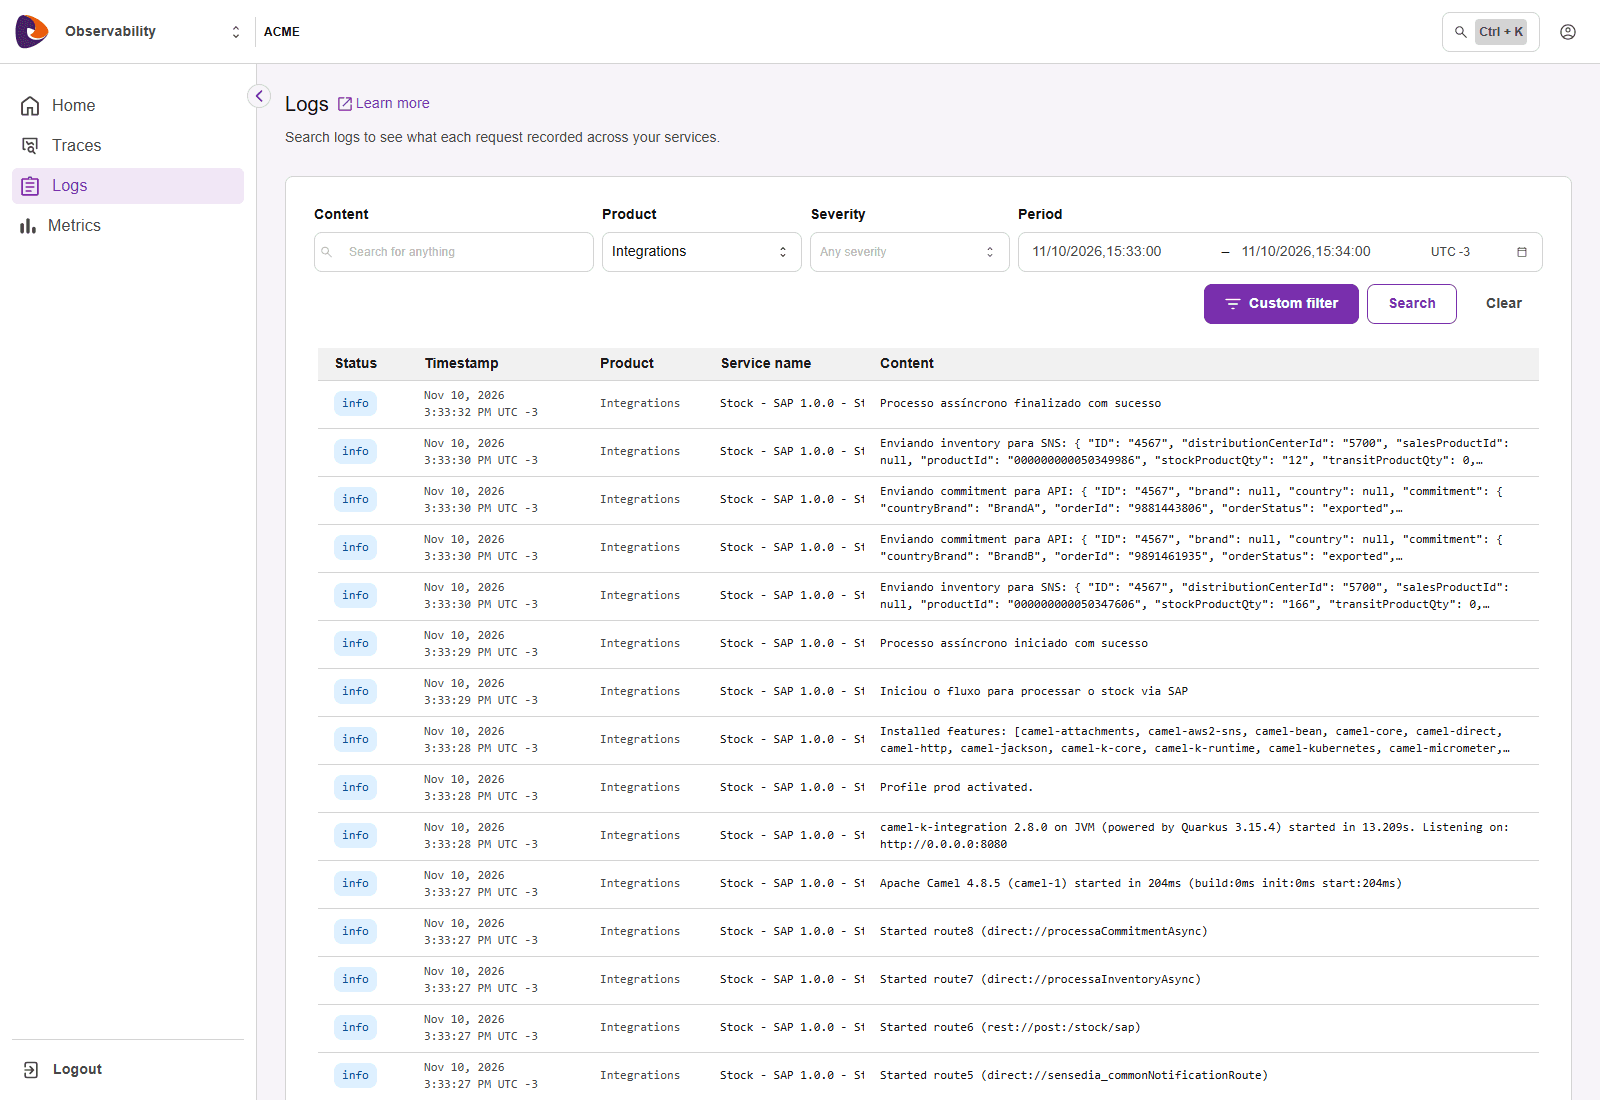
In Product, choose Integrations or AI Gateway.
Adjust the other filters, if you want.
Click Search.
IMPORTANTLog search always needs a product. While no product is chosen, the screen shows No logs found.
Filter | How to use |
|---|---|
| Content | Type a piece of the log text |
| Product | Choose the source of the logs. It is required |
| Severity | Choose one or more severities: Debug, Error, Fatal, Info, Trace, or Warning |
| Period | Edit the start and end date and time, or use the calendar icon |
To return to the initial state, click Clear.
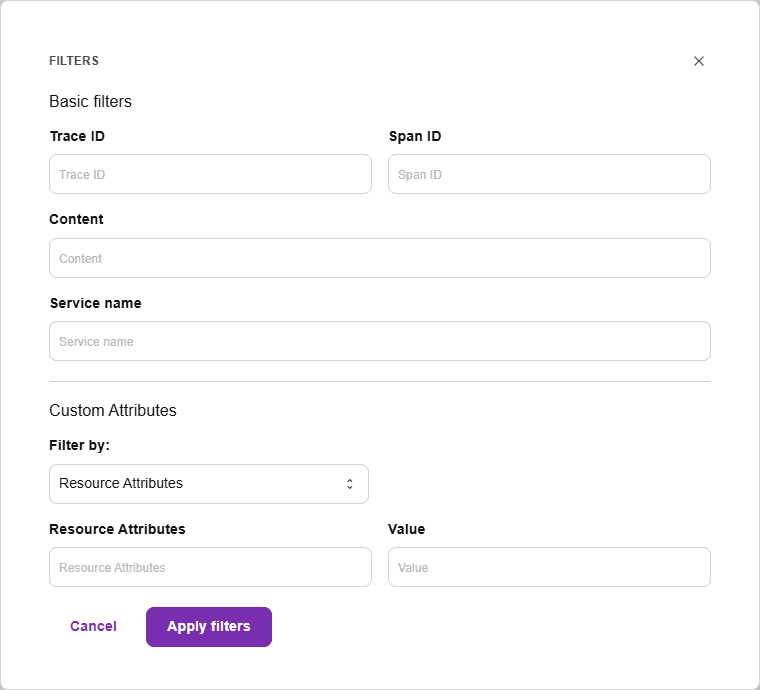
Click Custom filter to open the FILTERS panel.
Group | Fields |
|---|---|
| Basic filters | Trace ID, Span ID, Content, and Service name |
| Custom Attributes | In Filter by, choose Resource Attributes or Log Attributes. Then enter the attribute name and the value in Value |
Click Apply filters to search with these filters, or Cancel to close the panel without applying them.
Column | What it shows |
|---|---|
| Status | Severity of the log |
| Timestamp | Date and time of the record |
| Product | Source of the log |
| Service name | Service that recorded the log |
| Content | Text of the log |
Click a row to open the log details. In the footer, use the pagination to navigate through the results.
We use cookies to enhance your experience on our site. By continuing to browse, you agree to our use of cookies.Learn more