Creating, editing and deleting a visualization
Creating a visualization
Follow the steps below to create a visualization.
If you prefer, follow the steps in the video.
Step 3
Select the visualization type you want to create and, next, the data source. You can choose an index or a saved search.
Step 4
Once the visualization is created, define the configuration options that appear on the right side of the screen. Each visualization type has different options. The basic ones have the tabs: Data, Metrics & Axes and Panel — while the others have Data and Options tabs.
The image below shows, as an example, the steps to create a vertical bar chart that shows the amount of status code in last year's responses:
Watch the videos below with examples on how to create visualizations.
The first video shows how to create a visualization using a bar graph to display calls by status code:
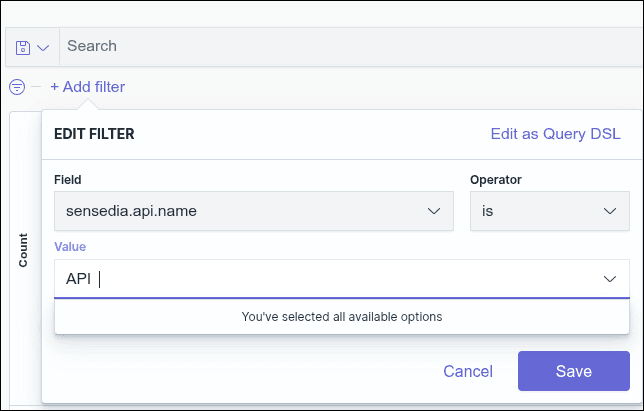
NOTEWhen adding a filter, for field values to be displayed in search autocomplete, they must reach a minimum volume of requests. If a value is changed, the new value will only start appearing in autocomplete after reaching this minimum volume again.
For example, if an API name is changed, the new name will only be suggested in autocomplete after a sufficient number of searches using this new value.
Watch next how to create a visualization using pie chart and line graph:
NOTEFor the filter type aggregation, remember to choose the correct syntax — Lucene or DQL — before writing your query.
Editing a visualization
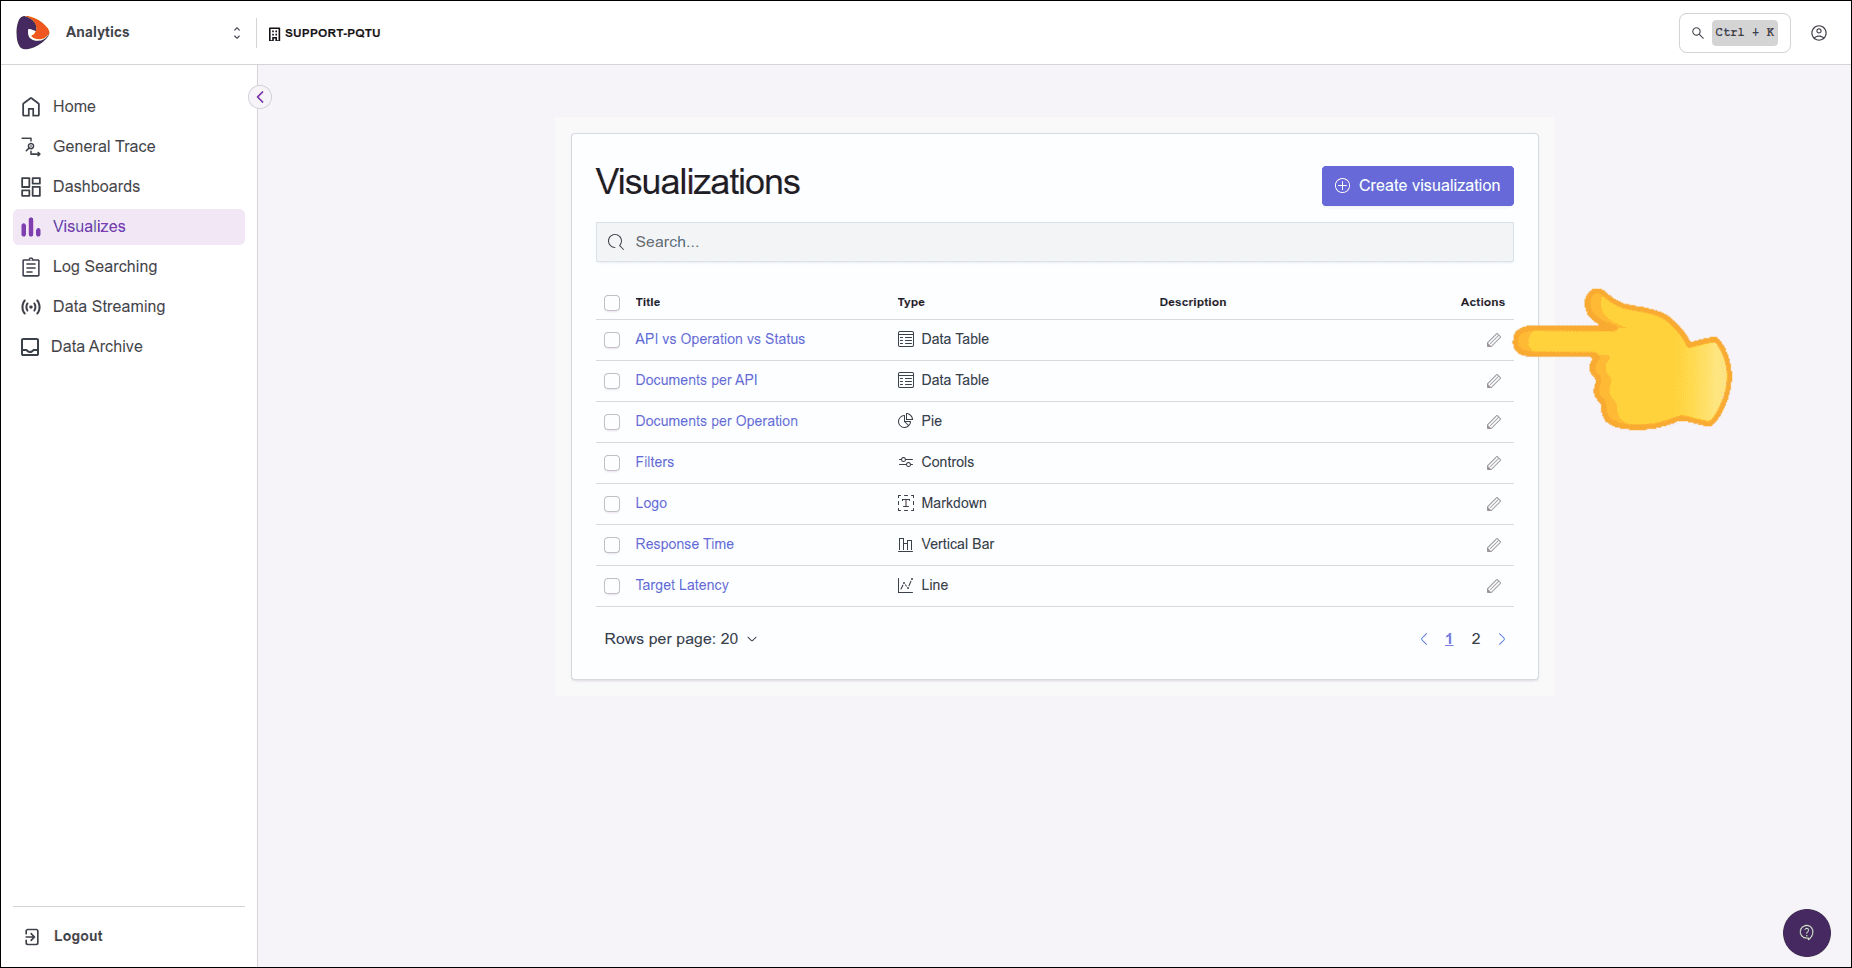
Saved visualizations are listed on the Visualize home screen.
To edit, click on the ![]() icon, in the Actions column (indicated by a red arrow in the figure below).
icon, in the Actions column (indicated by a red arrow in the figure below).
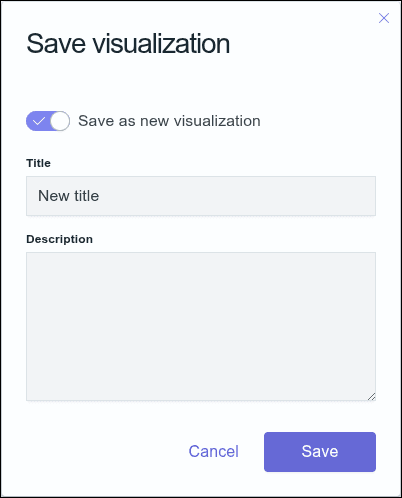
After editing, you can save changes to the existing file or save as a new visualization. To save it as a new visualization, click the SAVE button and, on the screen that opens, click Save as new visualization, as shown in the image below.
Deleting a visualization
Step 1
From the list of visualizations, select the one you want to delete. You can select more than one.
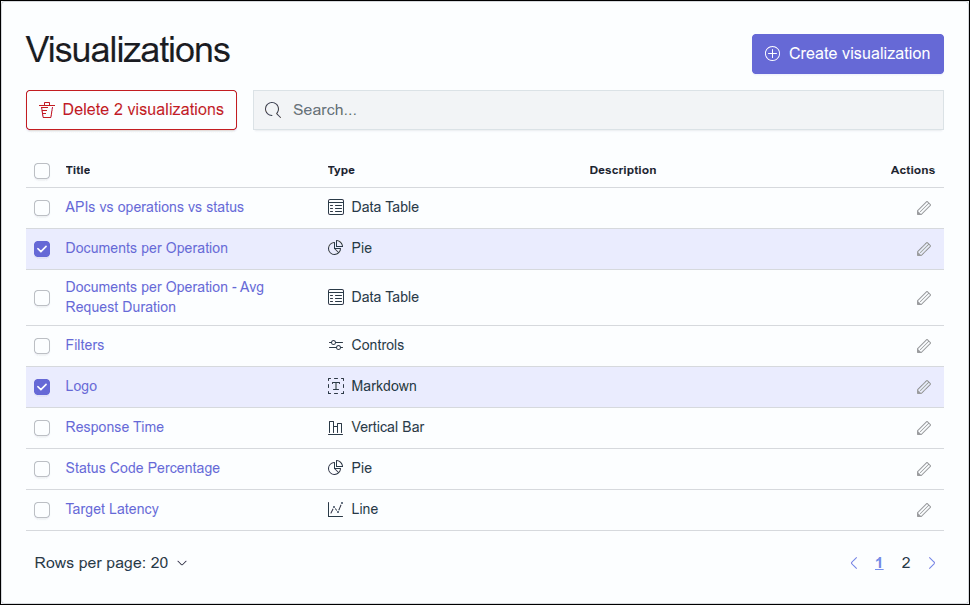
IMPORTANTDeleted views cannot be recovered.