- Home
- ...
- Building Integrations
- Test Mode
Console
The console is located at the bottom of the Source screen. To access it, click the up arrow icon (chevron) and expand the panel.
It contains the Test Mode and Error Validation tabs, which display:
-
Complete details of the integration deployment and execution in test mode.
-
Syntax and structure errors identified by the Full Validation feature (Source Code tab) or during saving of the
main.yamlfile. Read more about error validation.
Test mode
IMPORTANT
- Test mode is available for flows with Scheduling and Timing triggers: Cron, Quartz, Scheduler, and Timer and with REST triggers. For other trigger types, the test mode execution button remains locked.
- The flow for Scheduling and Timing triggers is described below. For REST triggers, which expose a temporary URL and let you send test requests from the console, see Test mode for REST trigger flows.
- Use test mode for quick validations and adjustments during flow development. For scenarios with large data volumes, deployment to a staging environment is recommended.
Test mode allows you to execute and validate an integration flow before final deployment, facilitating error identification, data validation, and performance optimization. You can test flows even while still under construction, enabling continuous adjustments.
Requirements
- Use a Scheduling and Timing trigger: Cron, Quartz, Scheduler, or Timer.
- Save the flow to enable the Test Mode button.
- If there are syntax errors or blank required fields, the test mode execution button will be locked. When saving, errors will be displayed in the error panel located below the code editor (Source Code tab).
- If the flow uses environment variables, the test will execute with values defined in environment variables in staging.
Step-by-step guide to deploy and execute an integration in test mode
Save the integration flow and ensure there are no syntax errors or inconsistencies. The Test Mode button will only be enabled after errors are corrected.
With the flow saved and error-free, click the Test Mode button  in the top right corner to initiate temporary deployment.
Next, expand the console (located at the bottom of the screen) to monitor deployment progress.
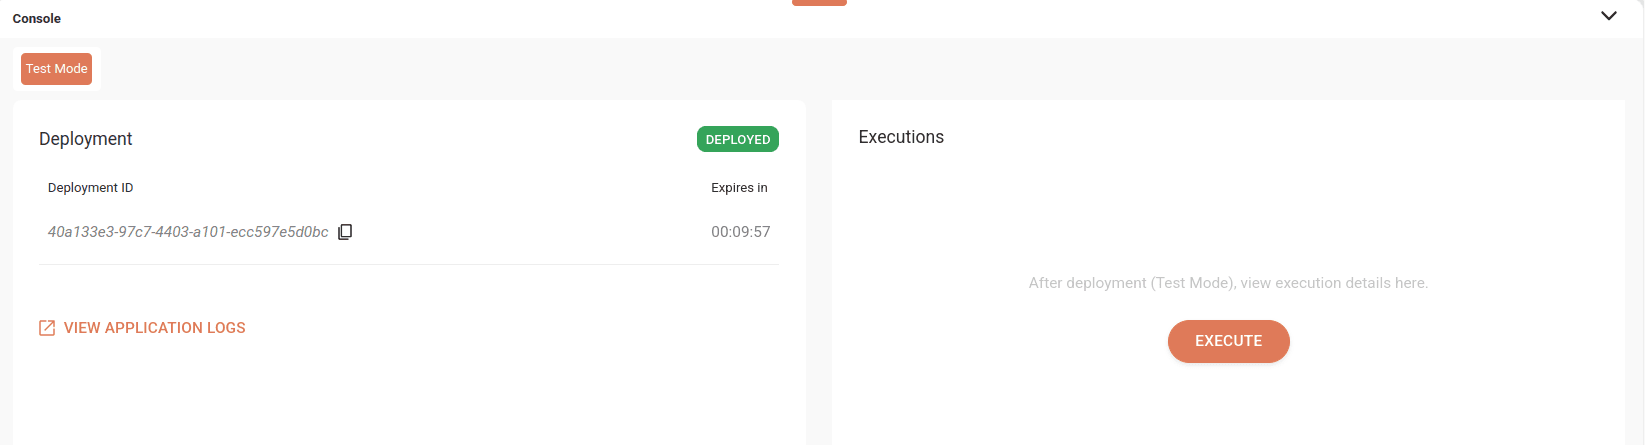
When the deployed status is displayed in the Deployment column, access the deployment logs in Analytics by clicking on the corresponding link, as shown in the image.
NOTEIf the deployment presents an error status, consult the logs in Analytics for details. The Error Validation tab displays only structure and syntax errors identified when running the "Full Validation" feature or when saving the integration.
With an active deployment (deployed), click the Execute button in the Executions column to start the test execution.
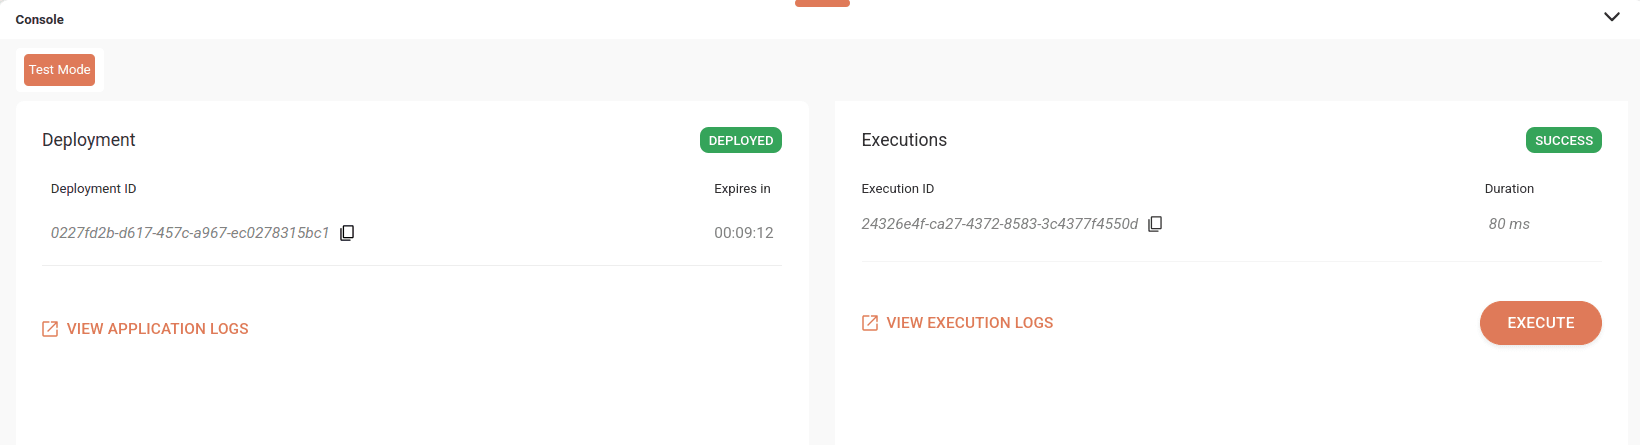
When execution completes, the Success status will be displayed and you can view logs in Analytics by clicking the link, as shown in the image.
Deployment Tab
This tab displays real-time deployment progress, including status (deployed, error, or expired), Deployment ID, and remaining time until temporary deployment expiration.
NOTEThe default expiration time is 10 minutes. The console displays a countdown timer showing remaining time; when this limit is reached, the deployment status automatically changes from deployed to expired.
You can also access deployment logs in Sensedia Analytics via the VIEW APPLICATION LOGS link.
Executions Tab
With an active deployment (deployed status), the EXECUTE button becomes available.
Clicking EXECUTE runs the integration in test mode. Upon completion, the Executions column shows the execution status (success or error).
You can also access execution logs in Sensedia Analytics via the VIEW EXECUTION LOGS link.
NOTE
- After execution, the EXECUTE button remains available for new executions, as long as no changes are made to the integration and the deployment remains active (meaning it has not expired).
- The tab displays a list of the five most recent executions, with links to view the corresponding logs.
Smart version management (smart redeploy)
The system identifies differences between the saved version and the running version. Therefore:
-
If the saved version is identical to the version running in test mode, logs remain accessible (respecting the expiration time limit).
-
If you save a change while test mode is running, a visual notification appears on the Test Mode button indicating integration changes and that the deployment is outdated.
-
Clicking the Test Mode button to update the deployment terminates the old version deployment and starts the new version deployment, restarting the lifecycle and expiration timer.
IMPORTANTEWhen the Test Mode button displays a notification, a new test is needed, either because the deployment expired or is outdated. See Smart version management (smart redeploy).
Test mode for REST trigger flows
For flows that start with a REST trigger, test mode provisions a temporary deployment and exposes a provisional URL, so you can validate the route logic by sending test requests — without going through a full Release and Deploy cycle.
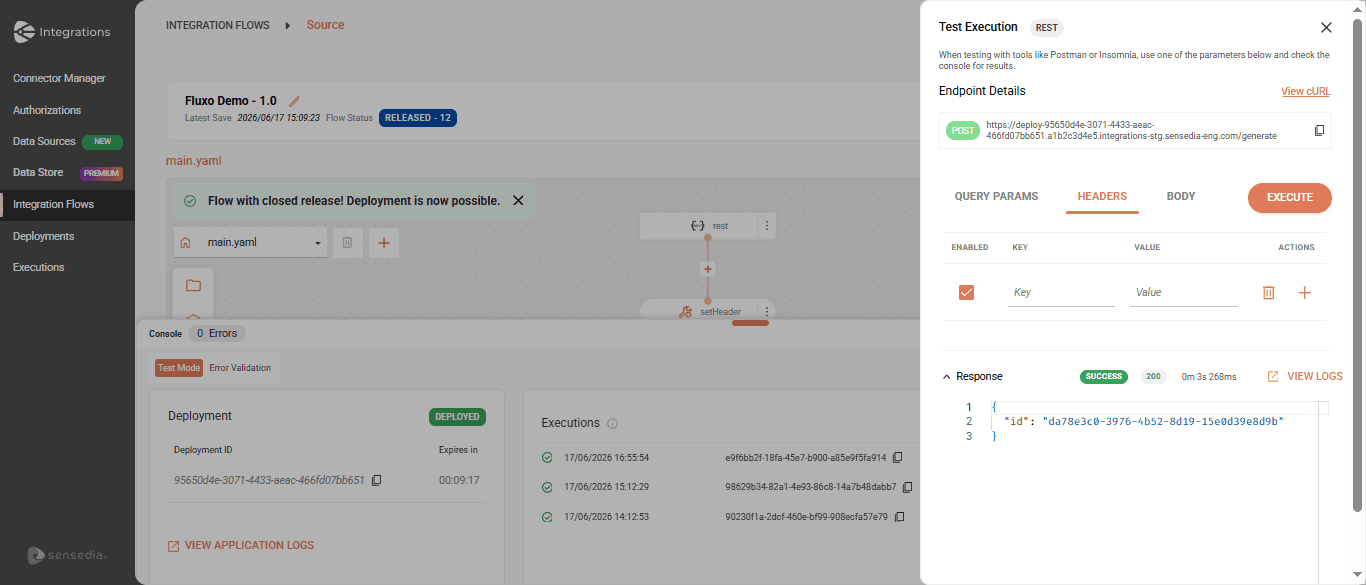
You can call the temporary endpoint in two ways: directly from the console (entering Headers, Query Parameters, and Body) or with an external tool (such as cURL or Postman) using the exposed URL.
IMPORTANTThe temporary URL is exposed externally. In environments without external exposure of Integrations, REST test mode is not available.
Deploying and exposing the endpoint
Start the temporary deployment
With the flow saved and error-free, click the Test Mode button to provision the temporary deployment. Expand the console to follow the progress.
Get the temporary endpoint
When the deployment reaches the success status, the panel displays:
- URL: the temporary address to call.
- Method: the HTTP verb configured in the trigger.
- Actions: option to view the request cURL.
Send test requests
Call the endpoint from the test execution console or with an external tool. Each call is recorded in the Executions tab in real time.
NOTEThe default expiration time is 10 minutes (TTL). When the time runs out, the status changes from deployed to expired and the temporary URL stops responding (external calls return HTTP 404).
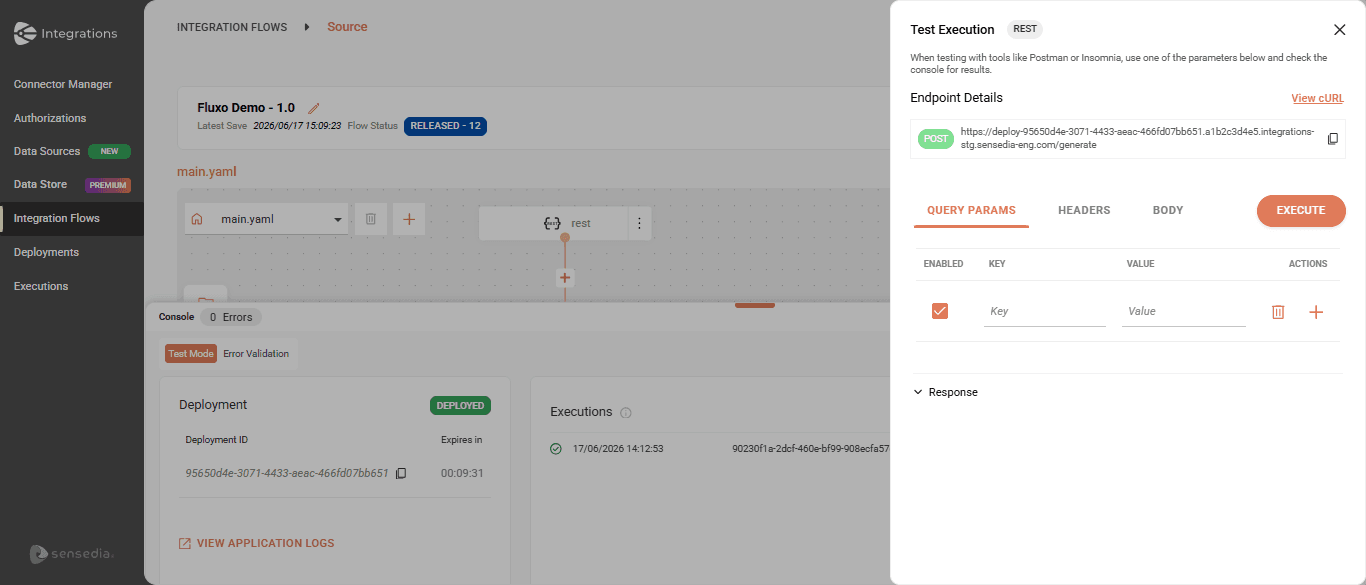
Test execution console
When REST test mode is active, the console shows a test execution panel that simulates the trigger input, so you can validate the route without external tools.
The panel lets you set:
- Headers: add multiple key/value pairs dynamically.
- Query Parameters: add multiple key/value pairs dynamically.
- Body: for methods that support a payload (POST, PUT, PATCH), a text editor with JSON/XML support.
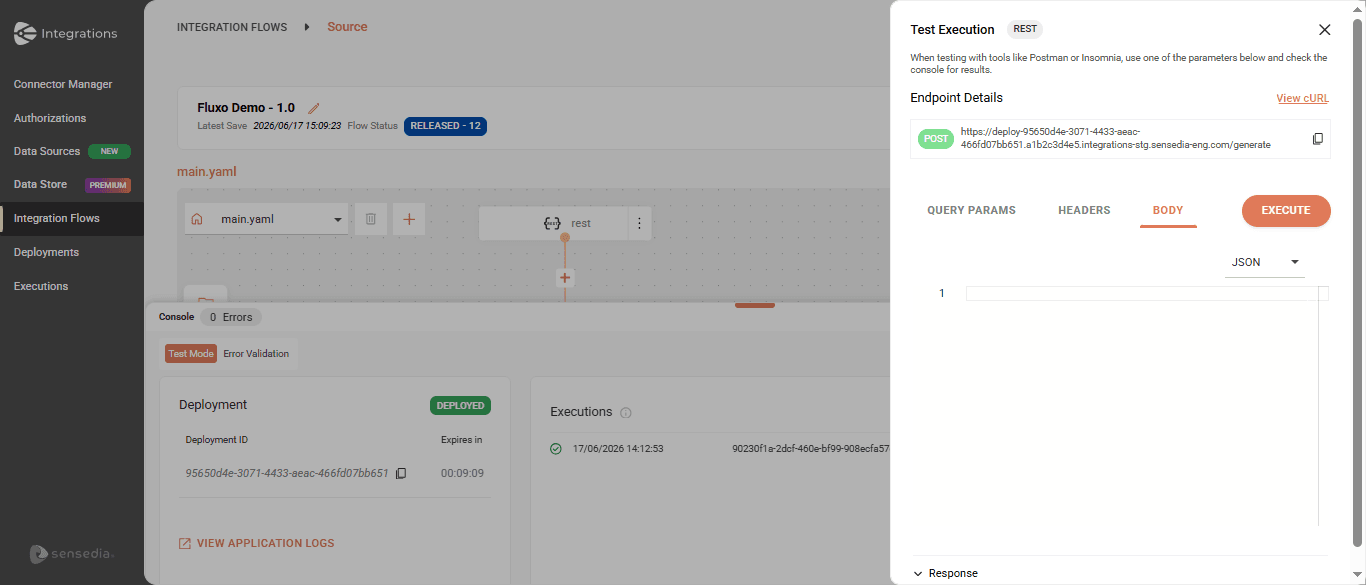
After running, the console shows the execution status, the Response Body, and the Status Code returned by the route.
IMPORTANTThe Body has a limit of 5 MB. If you exceed it, the console shows a warning and blocks the Execute button until the payload is within the limit.
NOTEThe console caches the last test data (Headers, Parameters, and Body) so you don't have to fill them in again on each execution.
Session expiration and restart
The frontend monitors the deployment status. If the TTL expires with the screen open, the status changes from Success to Expired (inactive deployment) and the main action button changes to Restart Test.
When you click Restart Test, the system triggers a new deployment without closing the console and clears the previous session's logs. If the code has not changed, the last stable image is reused for a faster startup.
NOTEWhile the deployment status is Deploying, leaving the Integration Flows screen or closing the browser shows a confirmation alert, since the operation is still in progress.