- Home
- ...
- Getting started
- Access
How to access
Sign in to the Sensedia platform with your user.
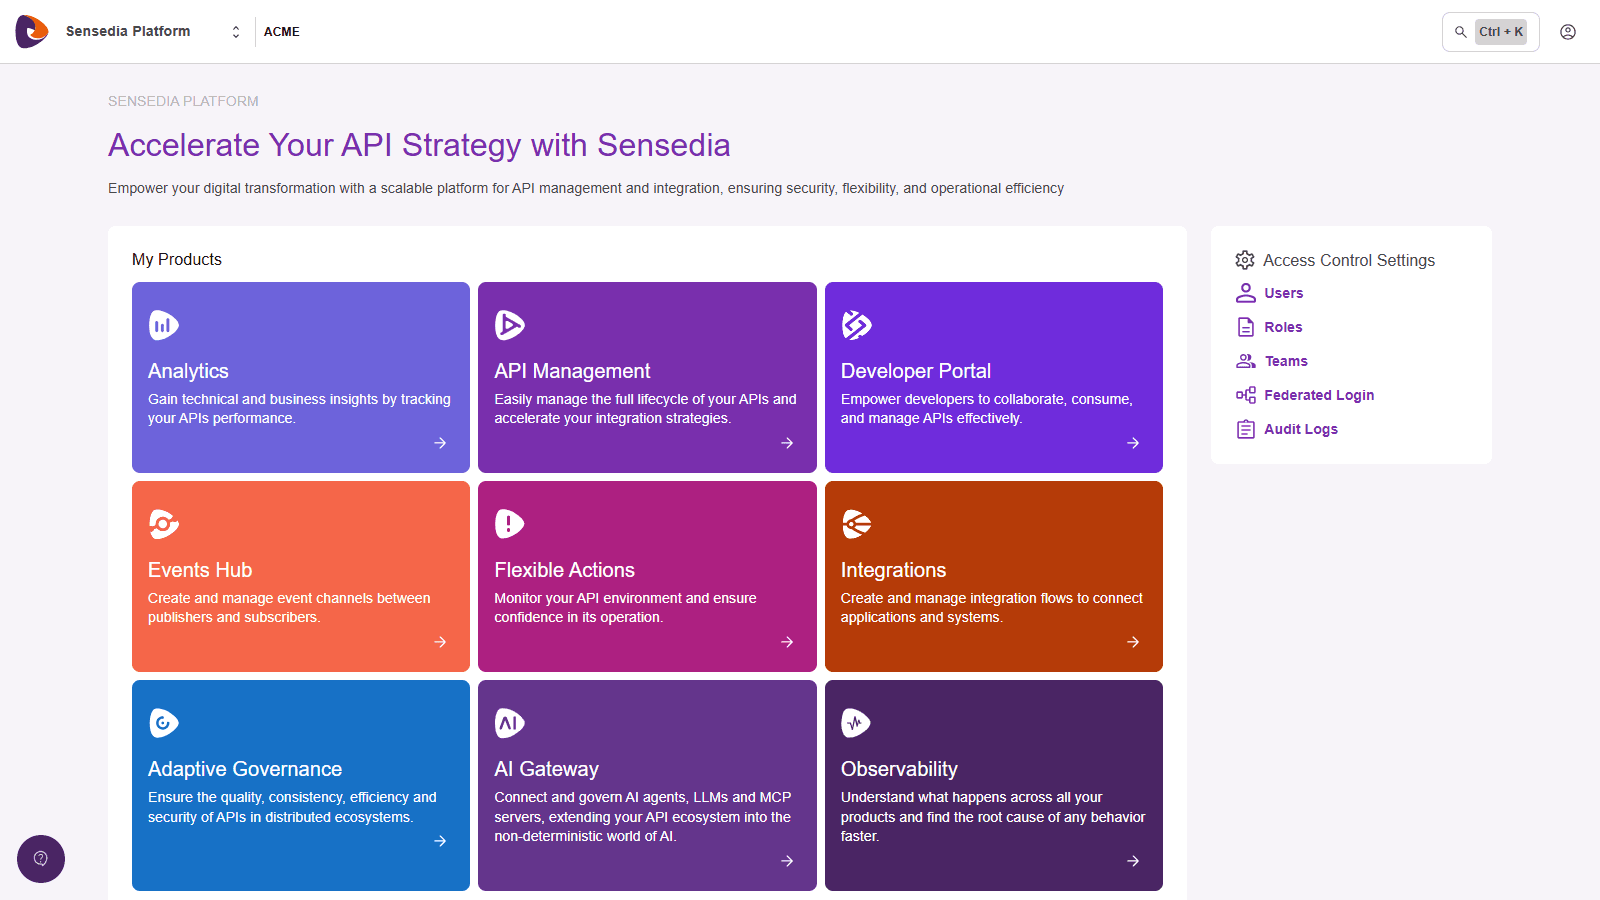
On the home page, click the Observability card, under My Products.
Use the side menu to switch between Traces, Logs, and Metrics.
TIPFrom inside any feature of the Sensedia platform, you can also reach Observability through the product selector, in the upper left corner.
Permissions
Access to each screen depends on Access Control permissions, in the Observability group. For Traces and Logs there are two permissions: one opens the list and the other opens the details of an item. For Metrics there is one.
Without the list permission for Traces or Logs, the item does not appear in the side menu.
See how to assign permissions in Permissions, in the Access Control guide.
Time zone
Dates and times appear in the time zone configured in your account, under My Account. The time zone in use is shown next to each period and each time, for example UTC -3.