- Home
- Documentation
- Observability
- Metrics
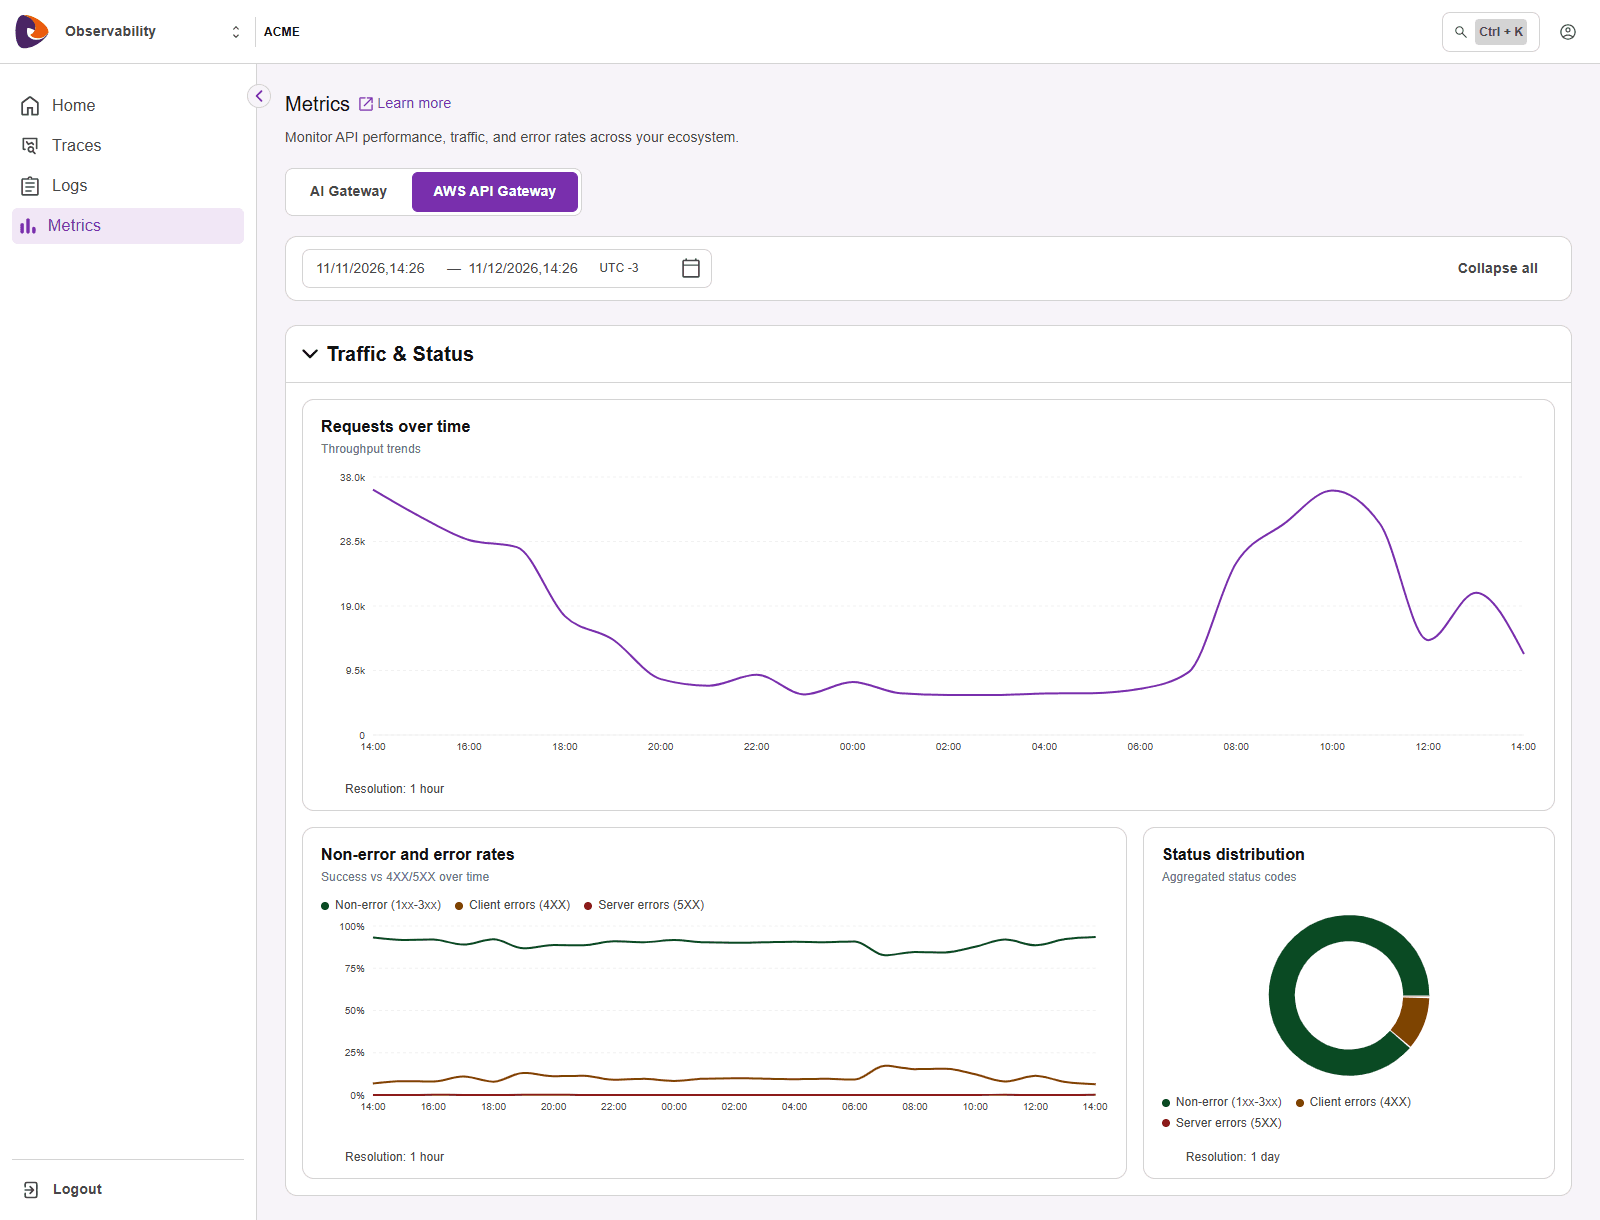
The Metrics screen shows ready-made dashboards with the metrics from your operation. There is one view for AWS API Gateway and another for AI Gateway.
IMPORTANTThe screen shows metrics only for what was contracted for your environment. The AI Gateway metrics depend on AI Gateway being contracted. The AWS API Gateway metrics depend on Adaptive Governance Multi-gateway being contracted.
Choose the view
At the top of the screen, choose AI Gateway or AWS API Gateway. The screen opens on AWS API Gateway.
AWS API Gateway metrics
What each chart on the AWS API Gateway dashboard shows and how to filter the data.
AI Gateway metrics
What each chart on the AI Gateway dashboard shows and how to filter the data.
Choose the period
The period field shows the start, the end, and the time zone in use. Edit the date and time in the fields themselves, or click the calendar icon to choose the day and time.
Read the charts
The charts are grouped into sections. Use the arrow next to the title of each section to collapse or expand it.
In the footer of each chart, Resolution indicates the interval of each point, for example 2 min, 1 hour, or 1 day. The resolution follows the selected period: the longer the period, the larger the interval.
No data and zero value
An interval with no data and an interval at zero mean different things:
- Interval with no data: appears as a gap in the chart line, not as zero. When you hover over the gap, the screen indicates that there is no data in that interval. It can be a sign that the metrics were not sent or did not arrive.
- Zero value: when data was collected and the measured value was zero, the chart shows zero. An error line at 0%, for example, indicates that there were requests and none failed.
- Percentages and rates: are calculated without counting the intervals with no data.
- Entire period with no data: the chart shows No data found. Widen the period or clear the filters.