- Home
- ...
- Metrics
- AI Gateway metrics
What each chart on the AI Gateway dashboard shows and how to filter the data.The AI Gateway view of the Metrics screen shows the consumption, latency, cost, and governance of the AI calls that go through AI Gateway.
This view only has metrics for those who have AI Gateway contracted.
Filter
- Period: when it opens, the view shows the last hour.
- Agent: in All agents, choose an agent and click Filter to see only its metrics. Clear goes back to all agents.
- MCP tool: in the Governance & MCP section, choose a tool in All MCP tools and click Filter.
Traffic & Tokens
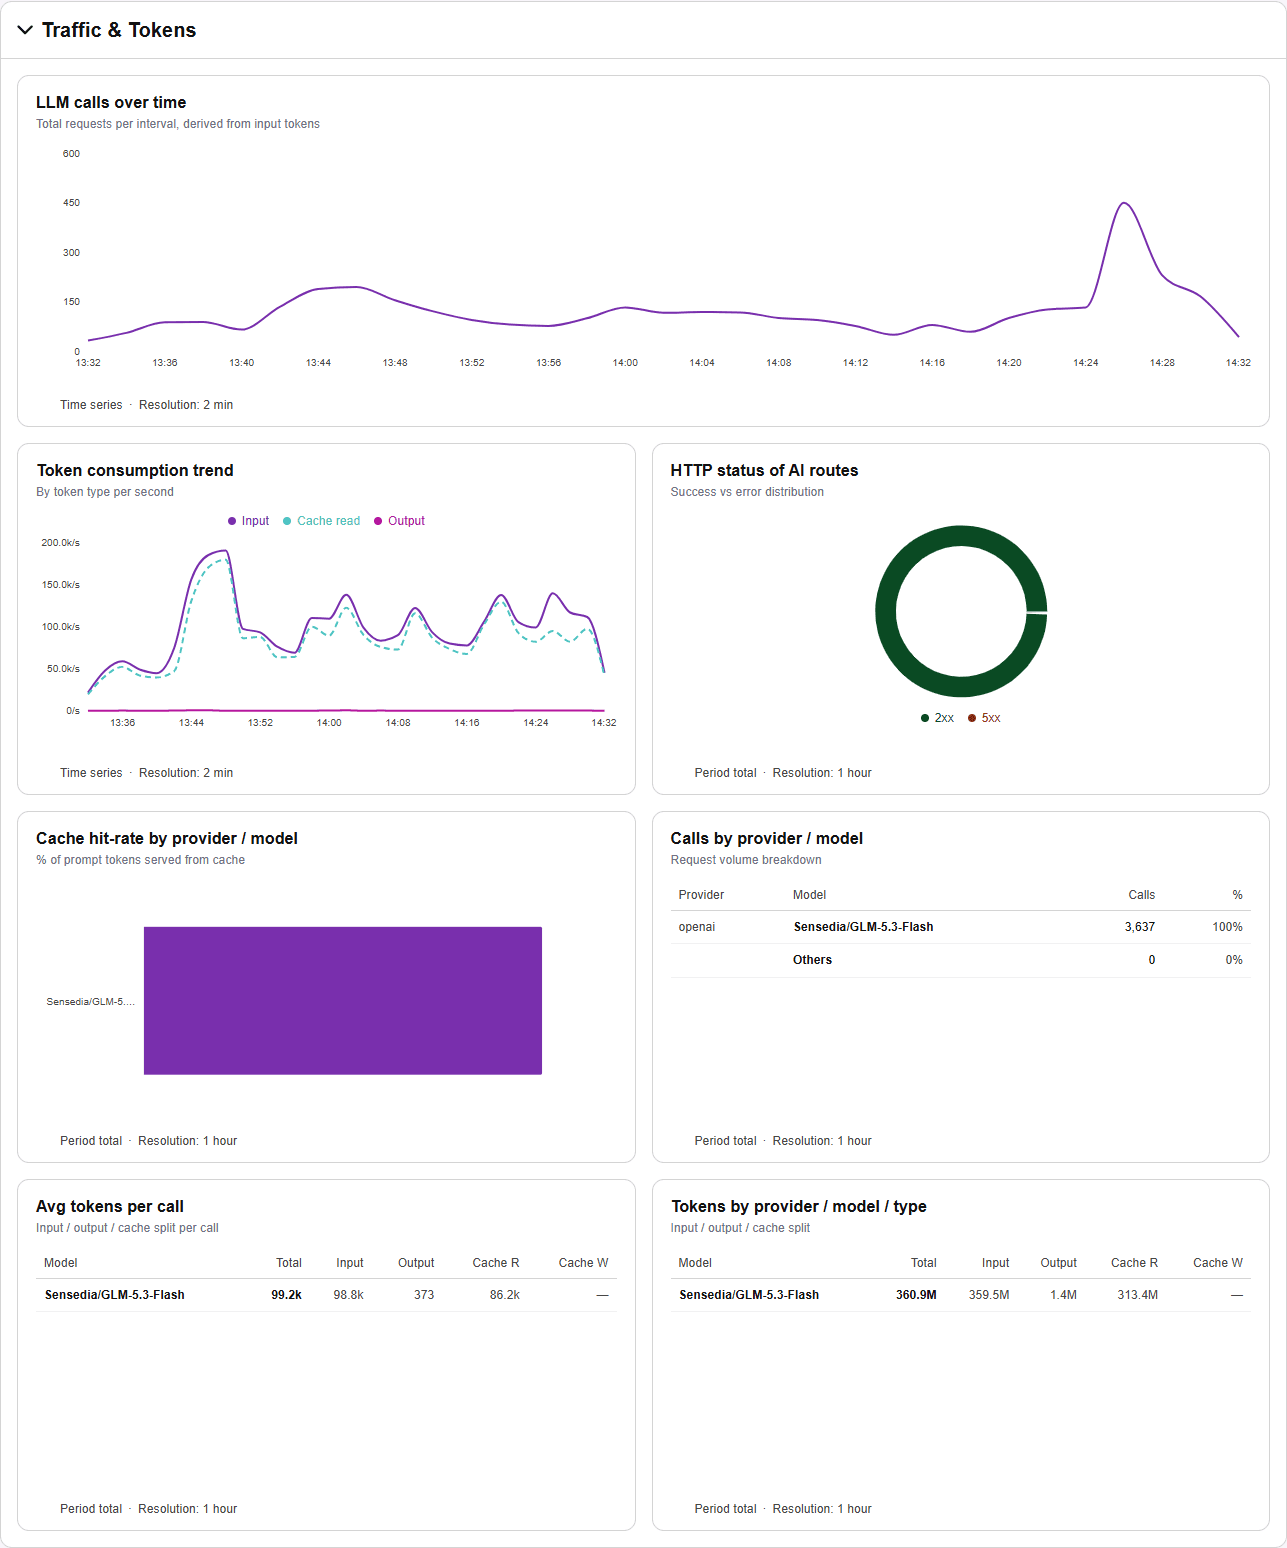
Chart or table | What it shows |
|---|
| LLM calls over time | Total calls to models per interval |
| Token consumption trend | Tokens per second, split into
input, cache read, and output |
| HTTP status of AI routes | Proportion of successful and error responses |
| Cache hit-rate by provider / model | Percentage of prompt tokens served
by the cache, by provider and model |
| Calls by provider / model | Volume of calls by provider and model |
| Avg tokens per call | Average tokens per call, split
into input, output, and cache |
| Tokens by provider / model / type | Total tokens by provider, model, and type |
Latency
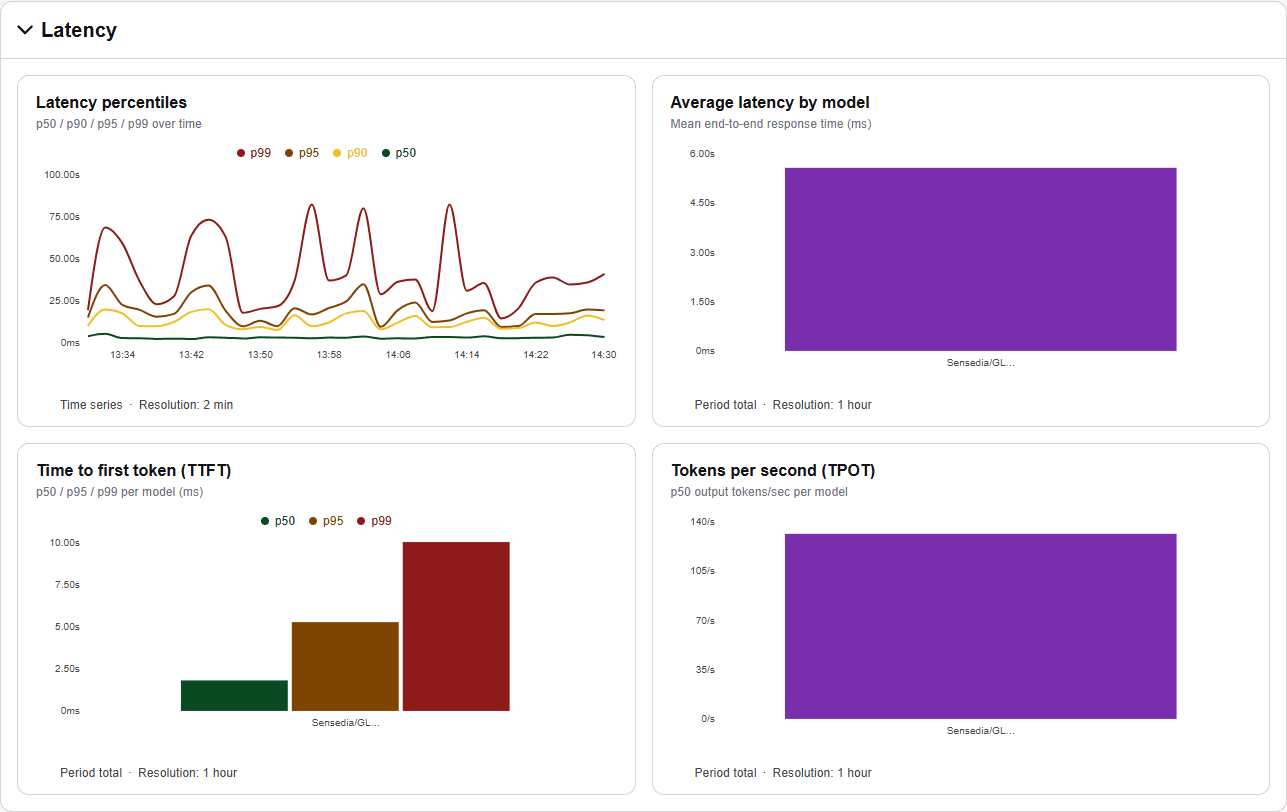
Chart | What it shows |
|---|
| Latency percentiles | p50, p90, p95, and p99 latency over the period |
| Average latency by model | Average end-to-end
response time, by model |
| Time to first token (TTFT) | Time to the first token of the response, by model |
| Tokens per second (TPOT) | Output tokens per second, by model |
Cost
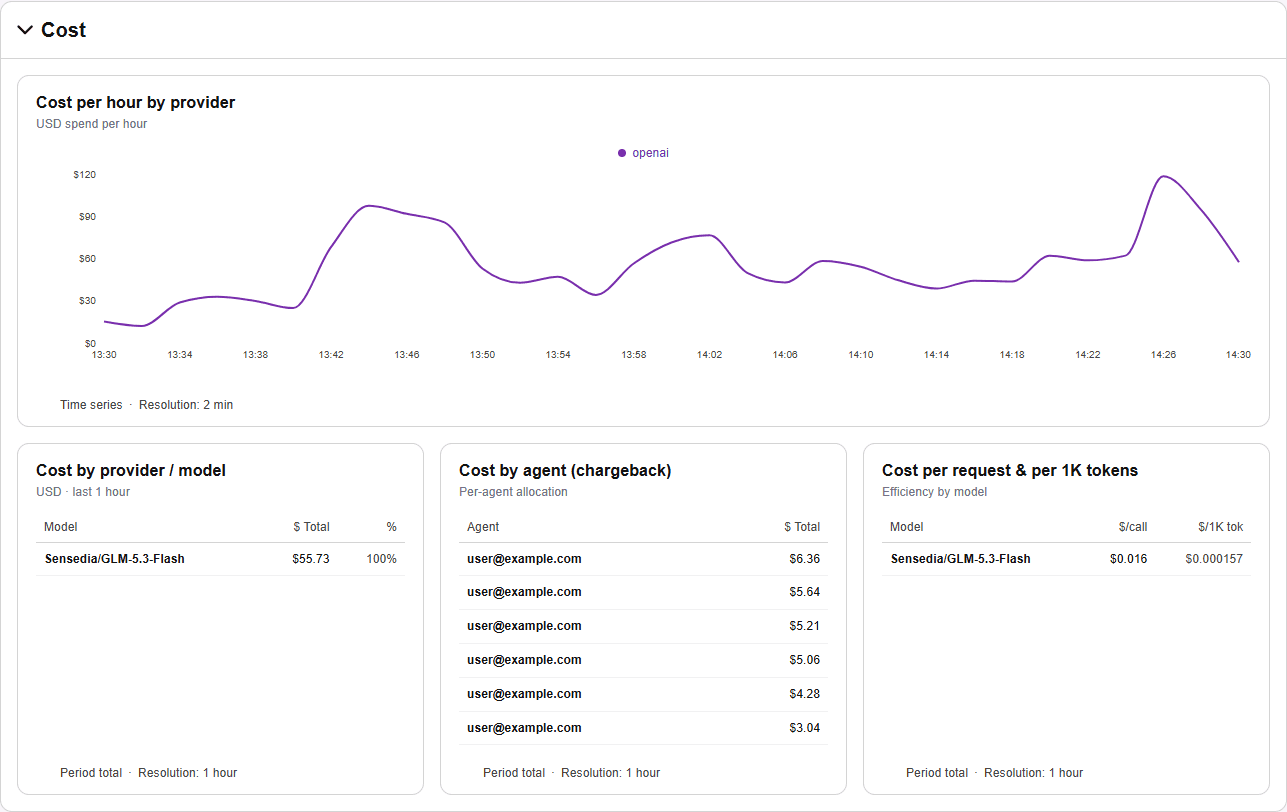
Chart or table | What it shows |
|---|
| Cost per hour by provider | Spend per hour, in dollars, by provider |
| Cost by provider / model | Spend in the period, by provider and model |
| Cost by agent (chargeback) | Spend attributed to each agent |
| Cost per request & per 1K tokens | Cost per call and per thousand tokens, by model |
Governance & MCP
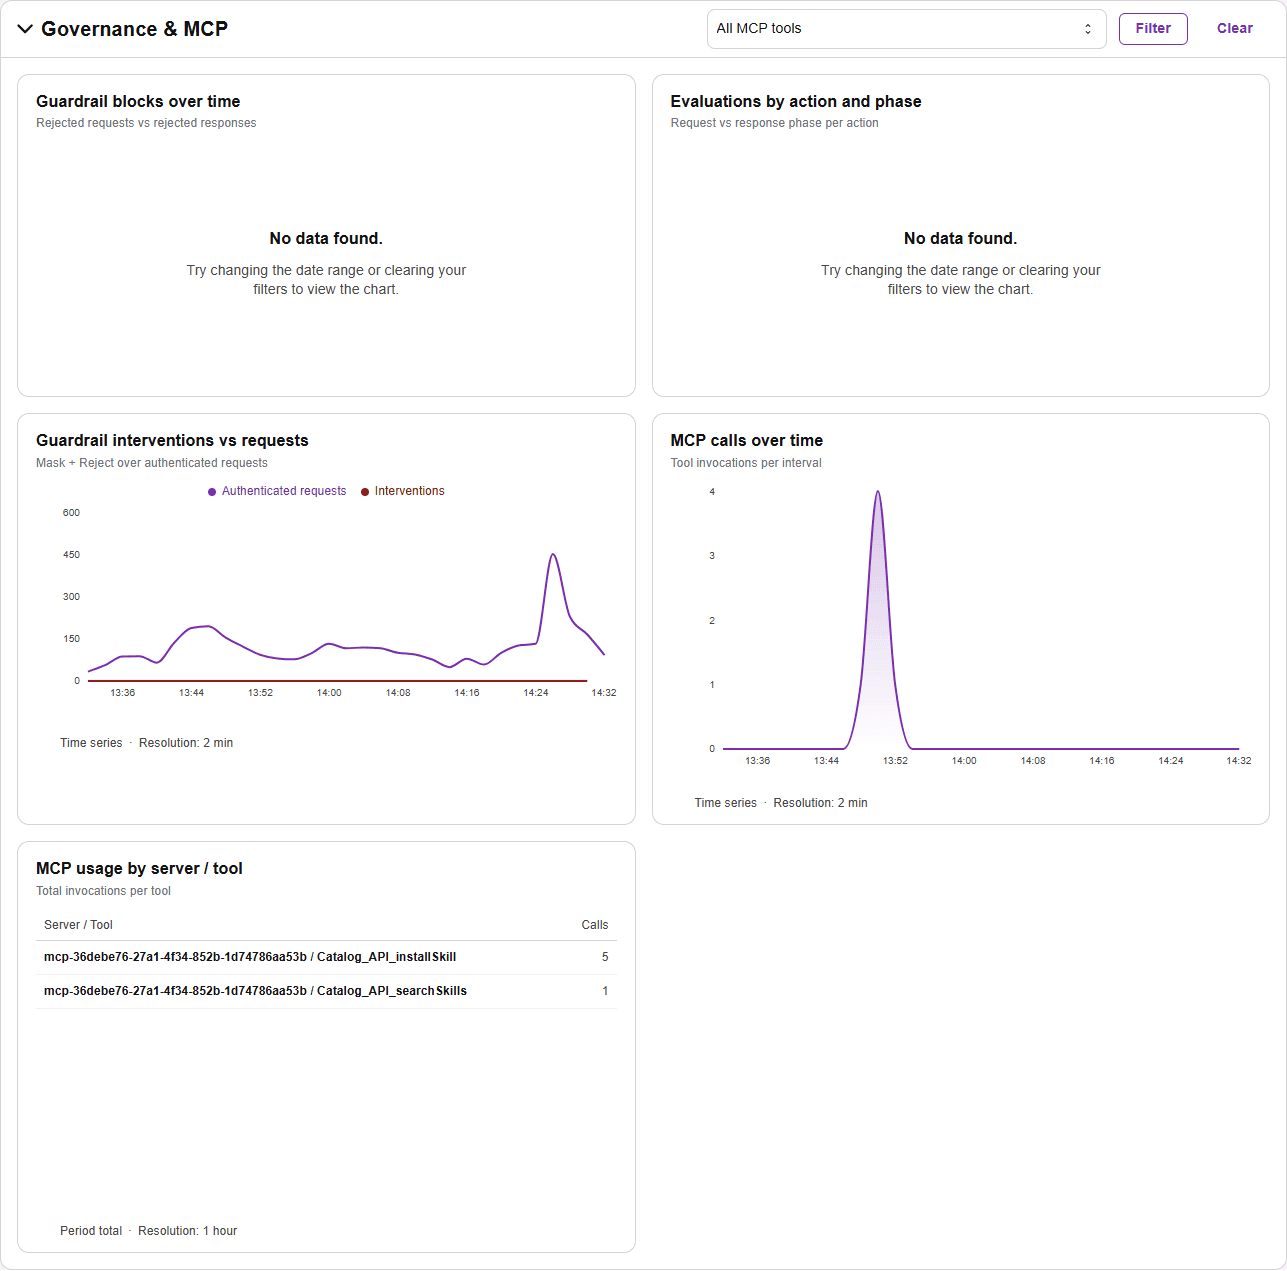
Chart or table | What it shows |
|---|
| Guardrail blocks over time | Requests and responses
rejected by guardrails |
| Evaluations by action and phase | Guardrail evaluations by action, in
the request and response phases |
| Guardrail interventions vs requests | Guardrail interventions relative
to authenticated requests |
| MCP calls over time | Calls to MCP tools per interval |
| MCP usage by server / tool | Total calls by MCP
server and tool |
To understand an empty chart or a chart at zero, see No data and zero value.
How happy are you with this page?