1. Home
  2. ...
  3. Metrics
  4. AWS API Gateway metrics

AWS API Gateway metrics

What each chart on the AWS API Gateway dashboard shows and how to filter the data.

The AWS API Gateway view of the Metrics screen shows the traffic, errors, and latency of your AWS API Gateway APIs.

IMPORTANT

This view only has metrics for those who have Adaptive Governance Multi-gateway contracted and have already configured the sending of the metrics.

To start sending the metrics, see Sending AWS API Gateway metrics.

Filter

Use the period field to choose the interval to analyze. When it opens, the view shows the last 24 hours. The Collapse all button collapses all sections at once.

Traffic & Status
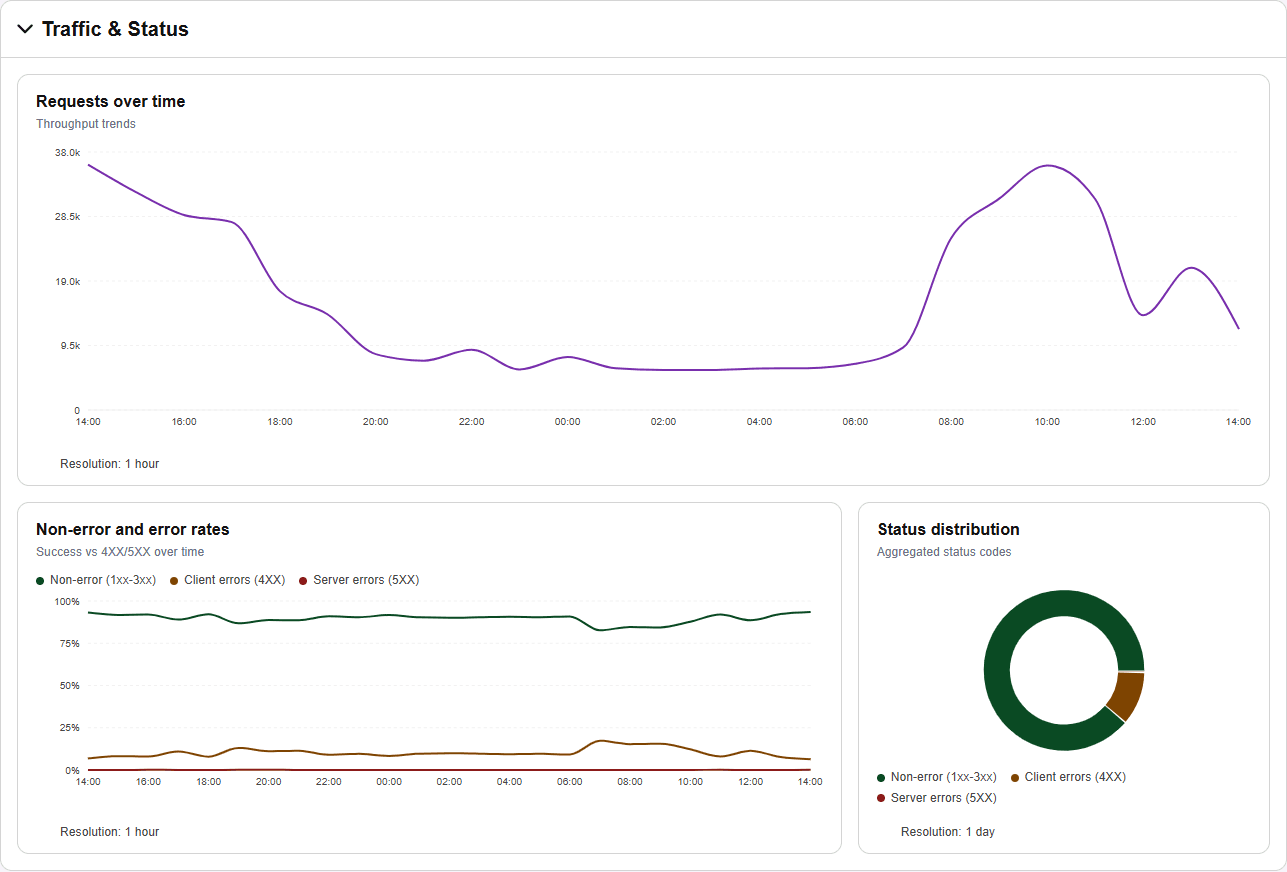
Traffic & Status section with the request and status charts

Chart
What it shows
Requests over timeVolume of requests over the period
Non-error and error ratesPercentage of responses with no error
(1XX to 3XX), with client error (4XX), and
with server error (5XX), over the period
Status distributionProportion of each status group over the entire period

Latency & Performance

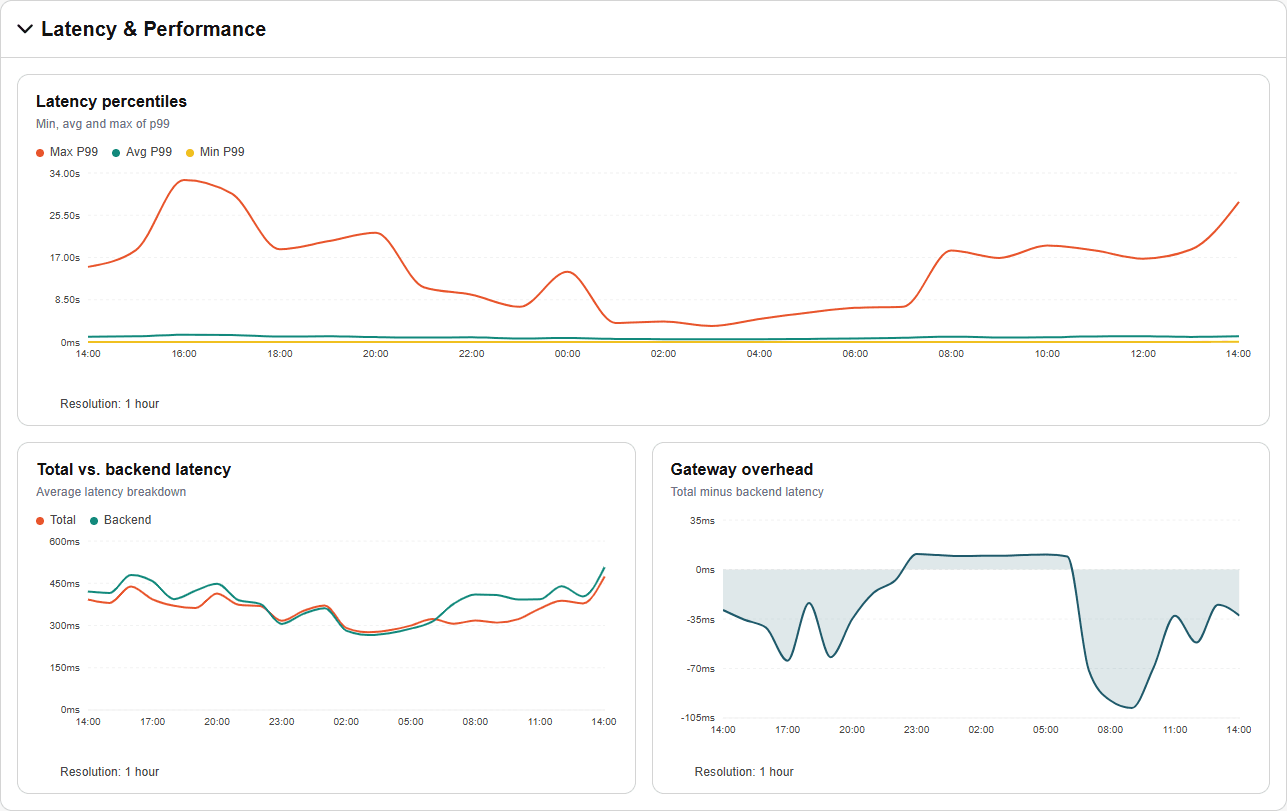
Latency & Performance section with the latency charts

Chart
What it shows
Latency percentilesMinimum, average, and maximum
of the p99 latency over the period
Total vs. backend latencyAverage total latency compared
with the average backend latency
Gateway overheadDifference between the total
latency and the backend latency

Top Offenders

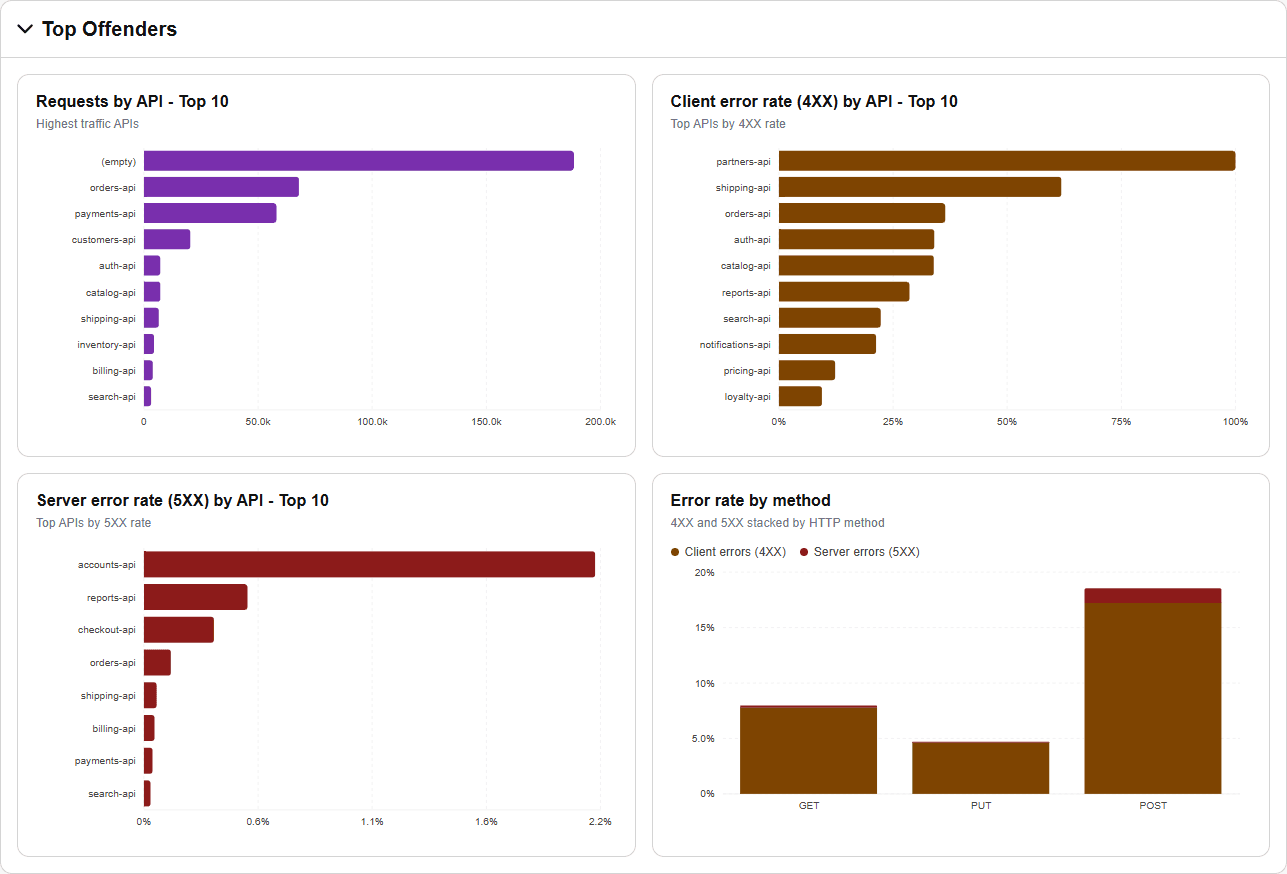
Top Offenders section with the rankings of APIs by traffic and by error

Chart
What it shows
Requests by API - Top 10The 10 APIs with the most requests
Client error rate (4XX) by API - Top 10The 10 APIs with the highest client error rate
Server error rate (5XX) by API - Top 10The 10 APIs with the
highest server error rate
Error rate by methodRate of 4XX and 5XX errors by HTTP method

To understand an empty chart or a chart at zero, see No data and zero value.

How happy are you with this page?

We use cookies to enhance your experience on our site. By continuing to browse, you agree to our use of cookies.Learn more