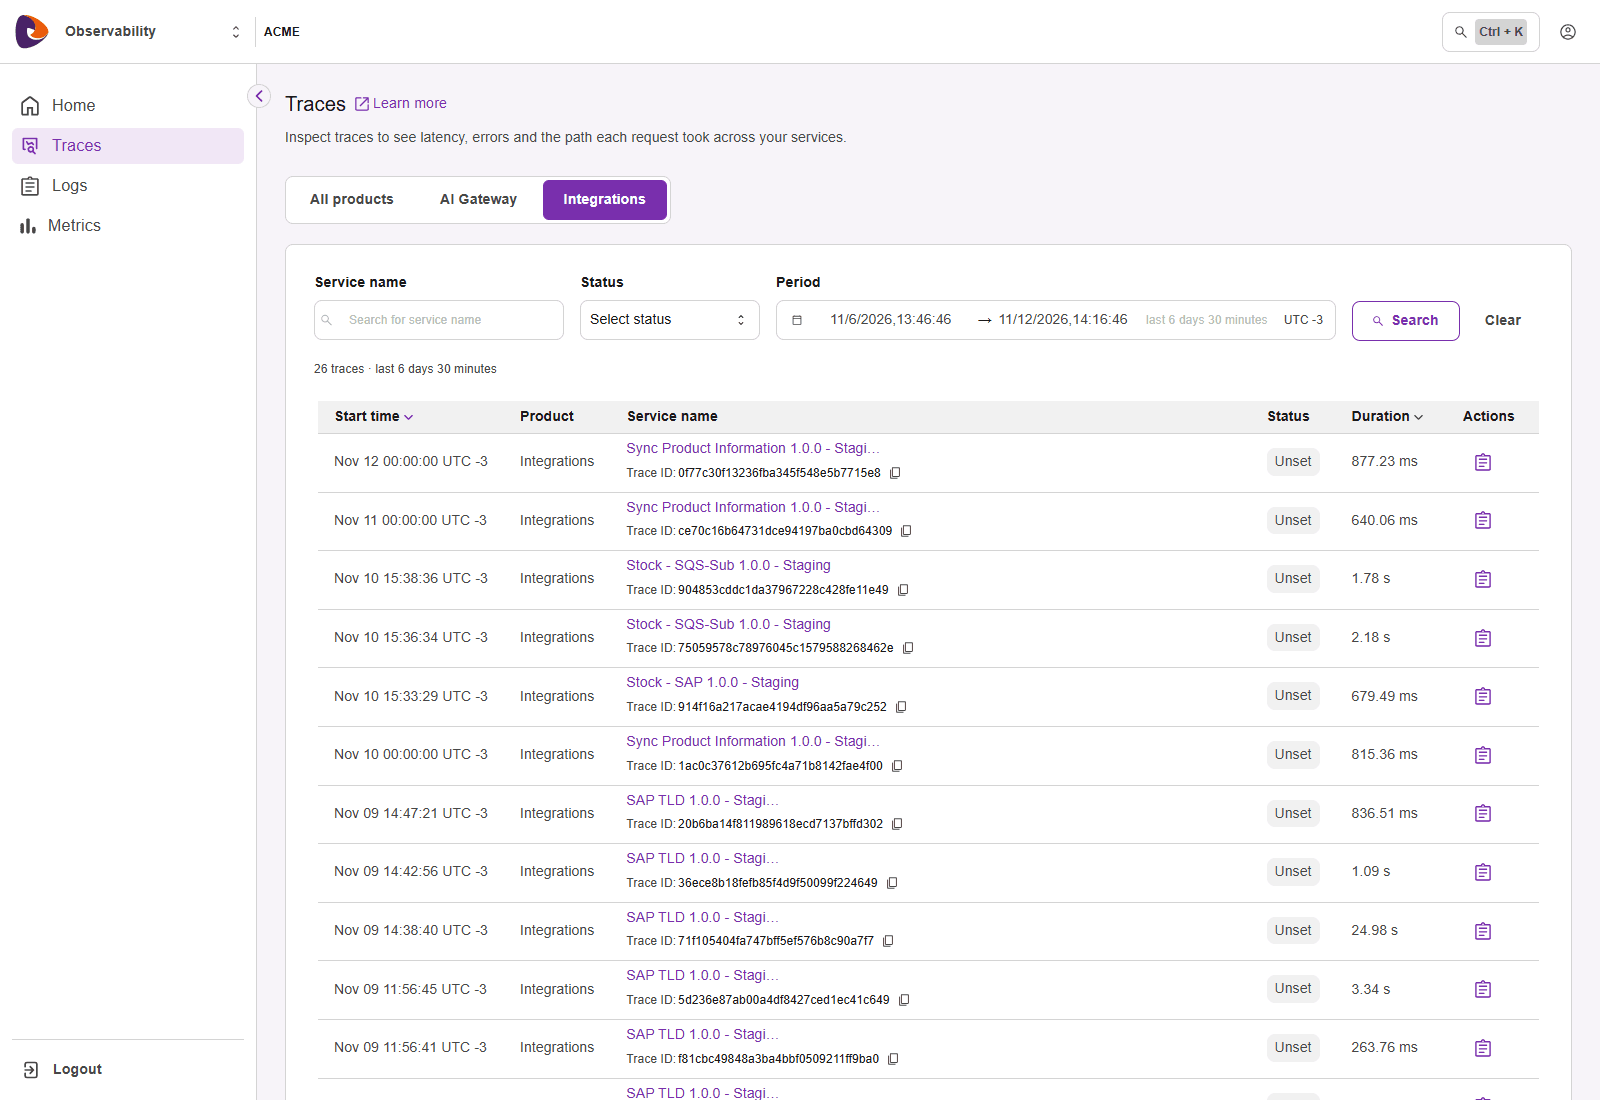
The Traces screen lists the traces received in the selected period. When it opens, it shows the last 30 minutes.
Choose the product
At the top of the screen, choose where the traces come from:
- All products: traces from all sources.
- AI Gateway: only traces from AI Gateway.
- Integrations: only traces from Integrations flows.
Filter
After adjusting the filters, click Search. To return to the initial state, click Clear.
Next to the period, the screen shows the size of the time window, for example last 30 minutes, and the time zone in use.
NOTEThe Unset status indicates that the service reported neither success nor error for that request.
Read the list
Above the list, the screen shows how many traces were found in the period.
Click the Start time or Duration header to sort the list by that column.
In the footer, use the pagination to go forward, go back, or go straight to a page.
When the search returns no results
If no trace matches the filters, the screen shows 0 total traces filtered. Widen the period or remove filters and search again.