---
title: Dashboards | Adaptive Governance
description: Track maturity indicators and violations in consolidated dashboards.
documentId: adaptive-governance-dashboards
locale: en-US
---
-
In **Dashboards**, you can monitor the maturity of your APIs through charts that consolidate quality metrics, making it easier to compare and identify disparities and redundancies more precisely.
See below:
- The **description** of each _dashboard_:
- [Maturity Timeline](#maturity-timeline);
- [Maturity by Months](#maturity-months);
- [APIs by Maturity Level](#apis-maturity);
- [Most violated rules](#violated-rules).
- The **steps to** (how to):
- [Filter data by _Owner_](#filter-owner) (person or [group](/docs/access-control/groups) responsible for the API).
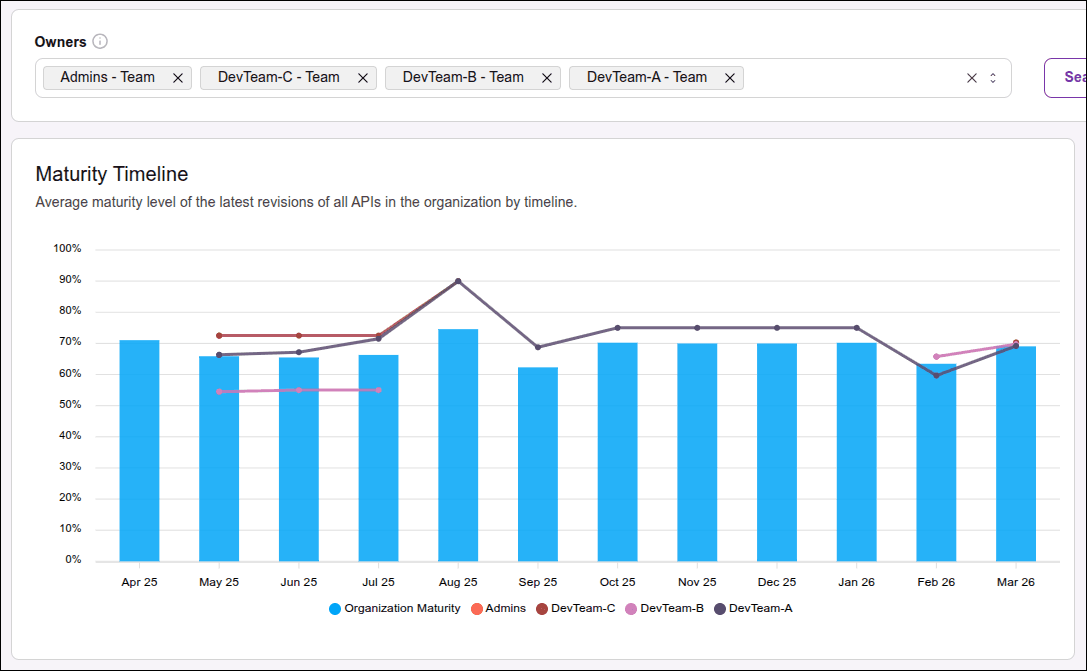
## Maturity Timeline
The **Maturity Timeline** dashboard consists of a bar chart that shows the average maturity level of the latest revisions of all the organization's APIs over time.
The x-axis (horizontal line) shows the time in months.
The y-axis (vertical line) shows the maturity percentage.
When selecting one or more Owners (persons or groups responsible for the API), lines will be added to the chart. Each line shows the average maturity level of the selected owner.
After selecting one or more Owners, you need to click the **SEARCH** button to update the chart.
The bar chart with the line chart allows you to view and compare the maturity level of the organization and other groups/users.
Hovering over the chart, you can see more details, such as the Owner and the exact value of the maturity score.
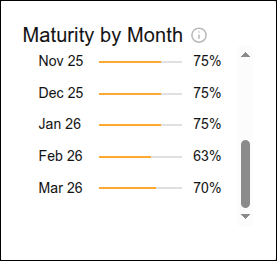
## Maturity by Months
The **Maturity by months** dashboard shows the average (in percentage) maturity level of the latest revisions of all the organization's APIs.
When selecting one or more Owners (persons or groups responsible for the API), the average is recalculated to reflect the maturity level of the APIs only for the selected owners. It is necessary to click the **SEARCH** button to update the chart.
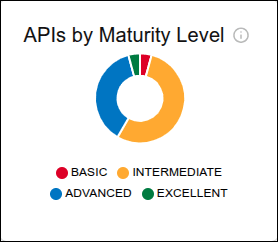
## APIs by Maturity Level
The **APIs by maturity level** dashboard consists of a pie chart whose slices show the number of APIs (only the most recent revisions) at each maturity level: basic, intermediate, advanced, and excellent.
Hovering over each slice, you can see the exact number of APIs at that level.
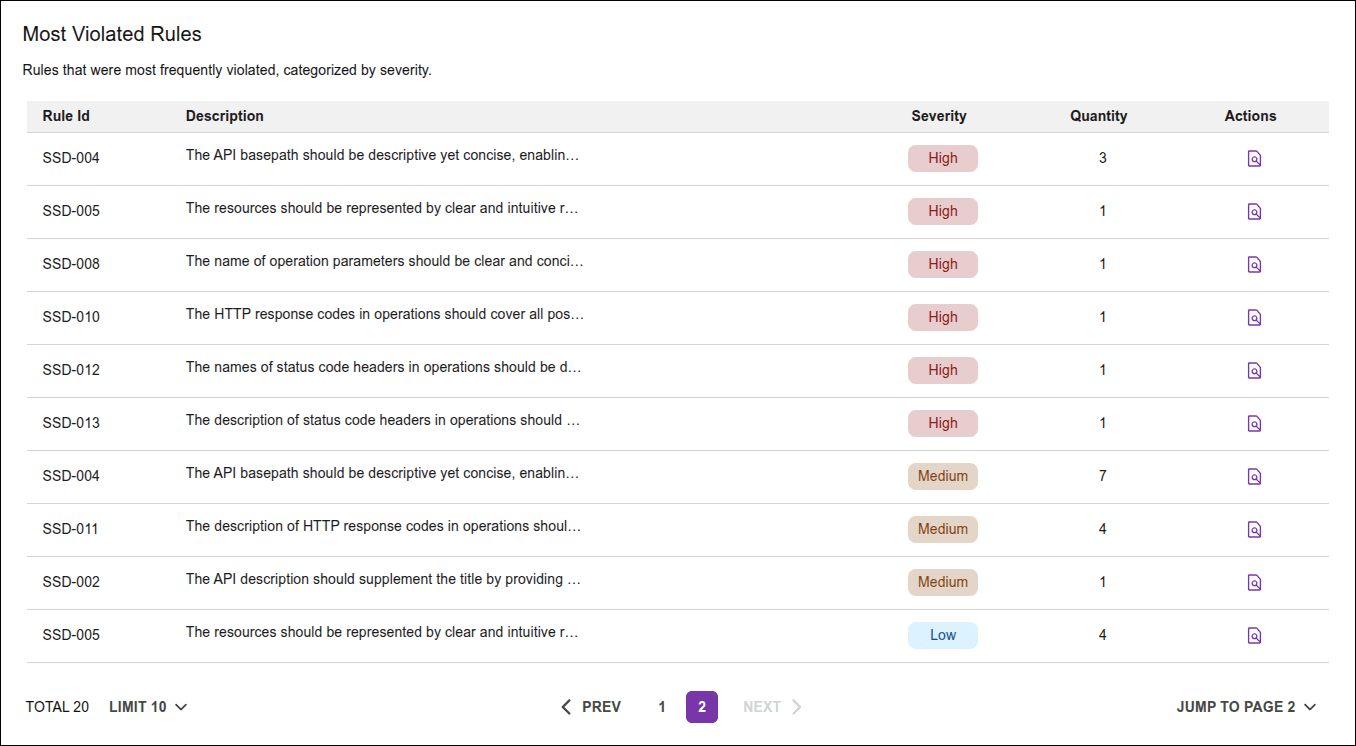
## Most violated rules
The **Most violated rules** dashboard consists of a table listing the rules that are most frequently violated, ordered by severity.
Rules that have not been violated are not listed in the table.
To see the complete list of rules, [access the maturity report](/docs/adaptive-governance/ag-maturity-report#how-to-access) and disable the toggle "View only violated rules".
The table columns are:
- **Rule ID**: ID that identifies the violated rule.
- **Description**: description of the violated rule, with information about its purpose and foundation.
- **Severity**: severity level of the detected violation, indicated by color.
- **High**: high severity, represented by the color red.
- **Medium**: medium severity, represented by the color yellow.
- **Low**: low severity, represented by the color blue.
- **Quantity**: total number of APIs that violate the rule.
- **Actions**: by clicking on the  icon, you will see the "API by violated rules" table, which contains the columns:
- **Name**: Name of the API that contains rule violations.
- **Version**: API version.
- **Owner**: group or person responsible for the API.
- **Maturity score**: [score](/docs/adaptive-governance/ag-maturity-report#score-level) of the API maturity.
- **Actions**: by clicking on the  icon, you will be directed to [Discovery](/docs/adaptive-governance/ag-discovery), on the [API details screen](/docs/adaptive-governance/ag-discovery-details), with its revision, environments, and other information.
## Filtering data by Owner
Owner is the person or [group](/docs/access-control/groups) responsible for the API.
You can select from 1 to 10 owners to filter the dashboard data.
To remove an owner from the selection, click on it again.
To remove all, click the **CLEAR** button.
After selecting the owners, click the **SEARCH** button. If you only select without clicking **SEARCH**, the dashboards will not be updated.
