---
title: API Status
description: Understand how to access API Status to view the availability and performance of your APIs in the Developer Portal.
documentId: developer-portal-api-status
locale: en-US
---
With API Status, you can check key information about the availability of your API resources in your Developer Portal.
This feature is only available for Sensedia gateways.
## Accessing your API information
Follow these steps to view your API information.
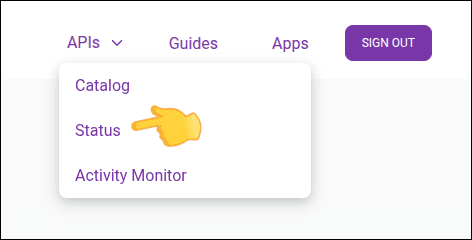
### Step 1
Log in to your Developer Portal and click on the top right menu [APIs > Status]. You can also use the direct link:
`https://{your-portal}/status`
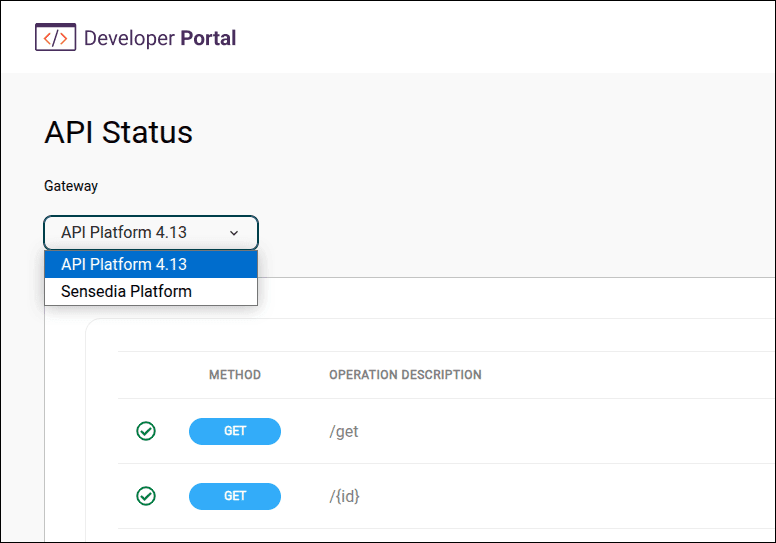
### Step 2
Select a Gateway.
### Step 3
Click the  icon in the **ACTIONS** column for the desired API. See also the [description of each column](#table-details).
### Step 4
The selected API's information will be displayed on the screen. See the [description of the fields](#modal-details) displayed.
You need to be logged in to access API Status.
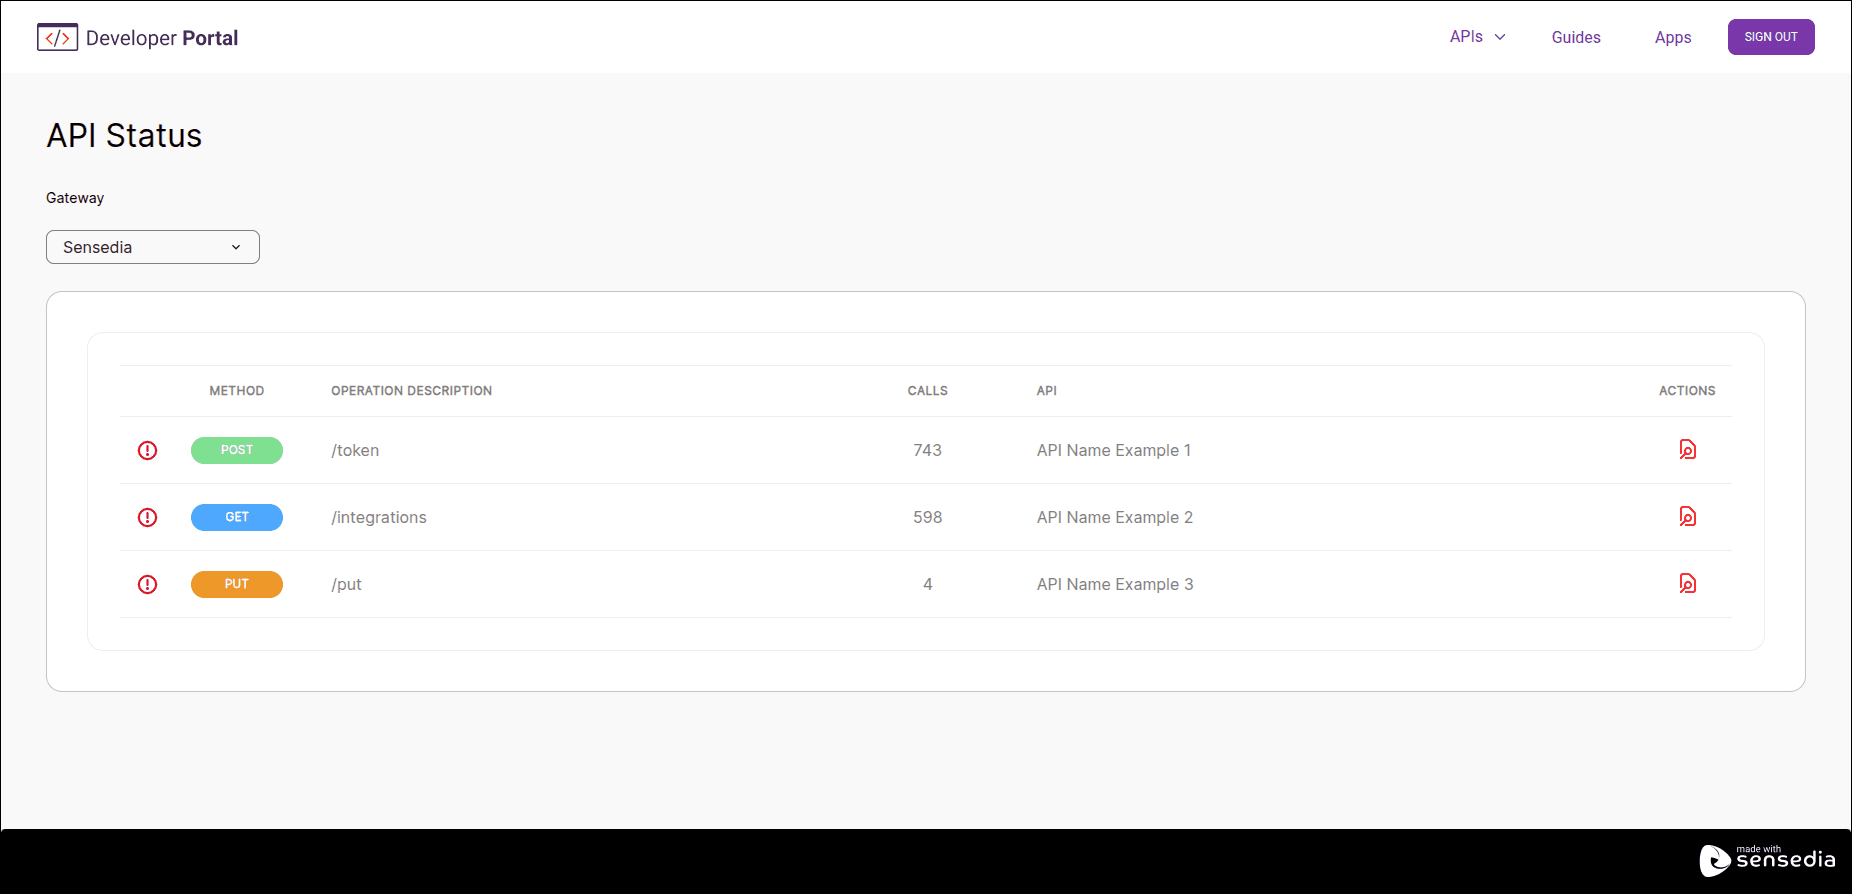
## Table Details
The API Status screen displays a table with the following columns:
- **Method**: HTTP method used in the call (e.g., GET, POST, PUT, DELETE).
- **Operation description**: Description of the operation.
- **Calls**: Number of calls made.
- **API**: API name.
- **Actions**: Actions available for the selected API.
-  Displays details about the selected API.
## API Availability modal screen details
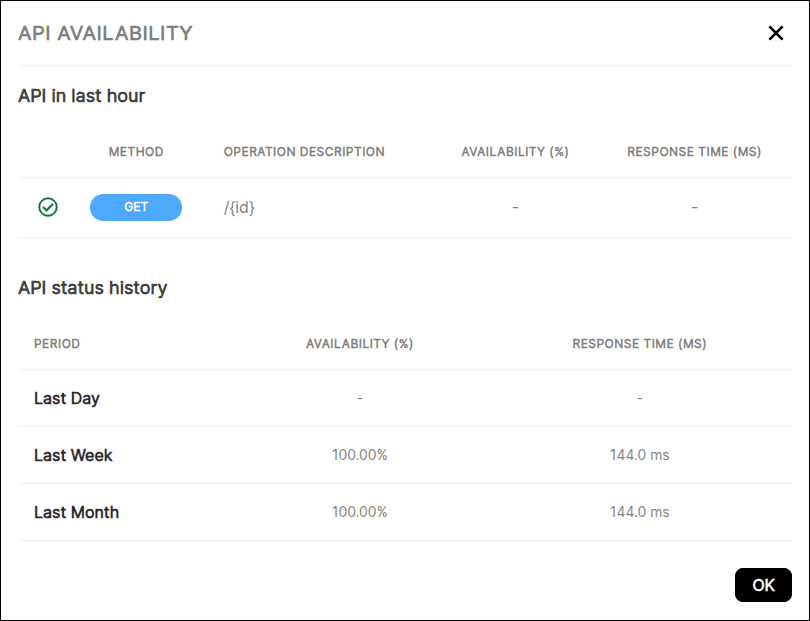
The **API Availability** modal screen displays the following information:
**API in last hour**
- **(icon)**: API availability indicator:
-  Availability greater than 90%
-  Availability less than 89%
- **Method**: HTTP method used in the call (e.g., GET, POST, PUT, DELETE).
- **Operation description**: Description of the operation.
- **Availability (%)**: API availability percentage.
- **Response time (ms)**: Average API response time in milliseconds.
**API Status - History**
- **Period**: Time period during which the API was monitored:
- **Last day**: Last day
- **Last week**: Last week
- **Last month**: Last month
- **Availability (%)**: API availability percentage.
- **Response time (ms)**: Average API response time in milliseconds.