---
title: Traces
description: Querying traces
documentId: ipaas-traces
locale: en-US
---
**Traces** are detailed records of the complete path of a message in an integration flow, showing the processed steps, the components involved, and the execution times.
They are essential for debugging, performance analysis, and identification of bottlenecks in the system.
In Sensedia Integrations, trace viewing is available from the **Executions** screen, by clicking the  icon.
Traces are only available for flows with _deployment_ in _Full_ mode (**Canvas** and **Diagram & Source Code** type flows).
**Enabling traces in Access Control**
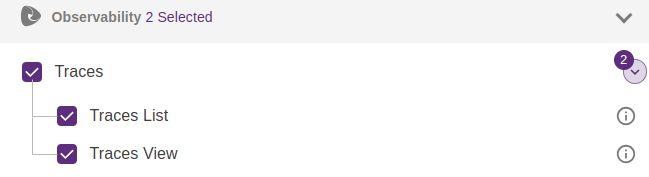
To enable trace viewing, when creating a policy (_role_) in Access Control, you must add the **Observability** permission group and select:
* Traces
* Traces List
* Traces View
The trace viewing option is visible only for executions performed after the _traces_ feature has been enabled.
See how to [create a policy (role) and enable permissions in Access Control](https://docs.sensedia-eng.com/pt-BR/docs/access-control#ac-policies).
When selecting the trace viewing option on the **Executions** screen, you will see the **Trace Detail** screen.
## Trace detail
The **Trace Detail** screen provides detailed traces of all _steps_ of an integration flow.
It allows you to view relevant information for monitoring and debugging executions, detailing attributes and metrics.
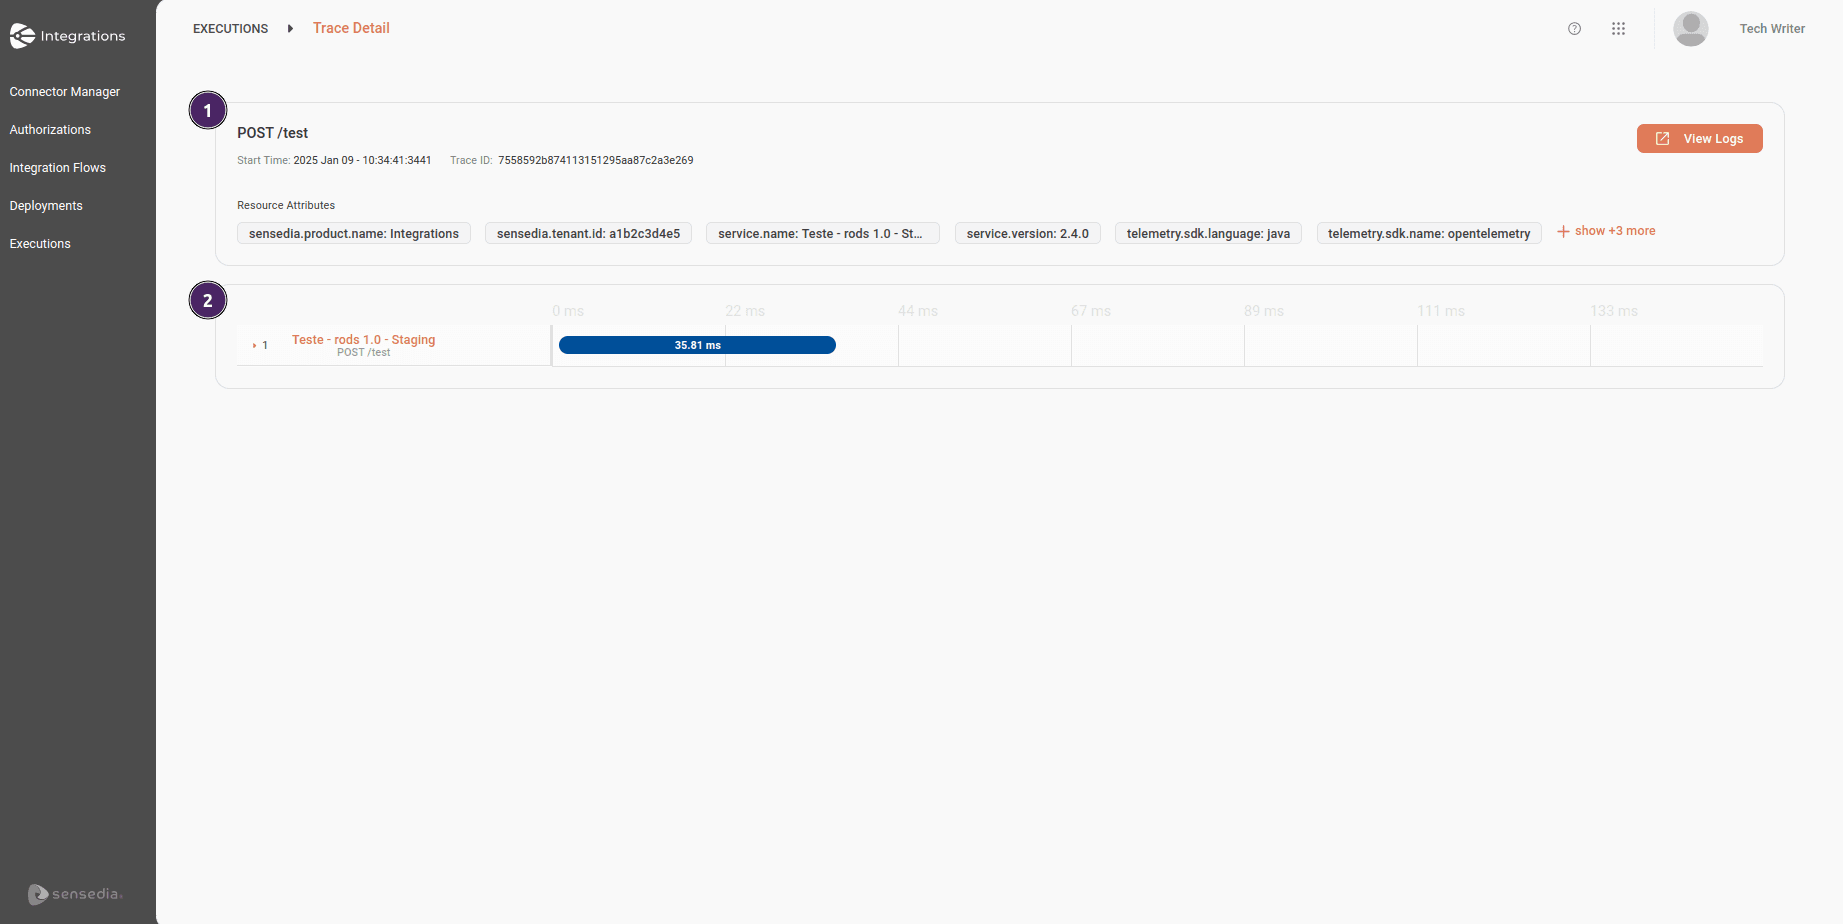
### 1. Flow trace overview
This section presents a summary with the main details of the _trace_.
* **Title**: name associated with the initial _step_ of the integration flow, the trigger.
* **Start Time**: date and time of the start of the integration flow execution.
* **Trace ID**: the unique identification of the integration flow _trace_.
* **View Logs**: allows you to view the flow _logs_ in [Sensedia Analytics](https://docs.sensedia.com/pt/analytics-guide/Latest/log-searching.html).
* **Resource Attributes and Span Attributes**:
* **Resource Attributes**: describe the environment and components involved in the execution of each _step_ within an integration.
These attributes provide contextual details about the system and help identify the resource responsible for execution, such as the product name, _tenant_ identification, service name and version, etc.
* **Span Attributes**: describe what was performed in each _step_ and provide context for performance analysis or problem diagnosis, such as the URI of the _endpoint_ used in the _step_, the Camel component responsible for execution, the HTTP method used, etc.
To view the complete list of **Resource Attributes** and the list of **Span Attributes**, click **+ show more**, highlighted in red (located at the end of the resource attributes line).
When you click, the information will be displayed on the right side of the screen.
### 2. Execution Time
The first bar in the graph represents the _trace_ of the complete flow, indicating the total execution time.
To view the _steps_ individually with their respective execution times, click the expansion arrow  to the left of each one.
The bars are organized hierarchically, one below the other, detailing the duration of each _step_.
By clicking on any bar or _step_, you can view the corresponding **Resource Attributes** and **Span Attributes**.
If you wish, you can also view the _logs_ of each _step_ in [Sensedia Analytics](https://docs.sensedia.com/pt/analytics-guide/Latest/log-searching.html), by clicking **View Logs**.
To better identify which step the trace line belongs to, check the information in the "camel.uri" and "component" fields in the **Span Attributes** tab.
See in the animation how to view **Resource Attributes** and **Span Attributes** of a _step_.
The bars with the nomenclatures below correspond to asynchronous events that occur internally in the context of integrations:
* "sensedia_wireTapOnCompletion"
* "sensedia_onCompletion"
* "sensedia_commonNotificationRoute"
* "aws2-sns"