To open the details of a trace, click the button in the Actions column, in the list of traces.
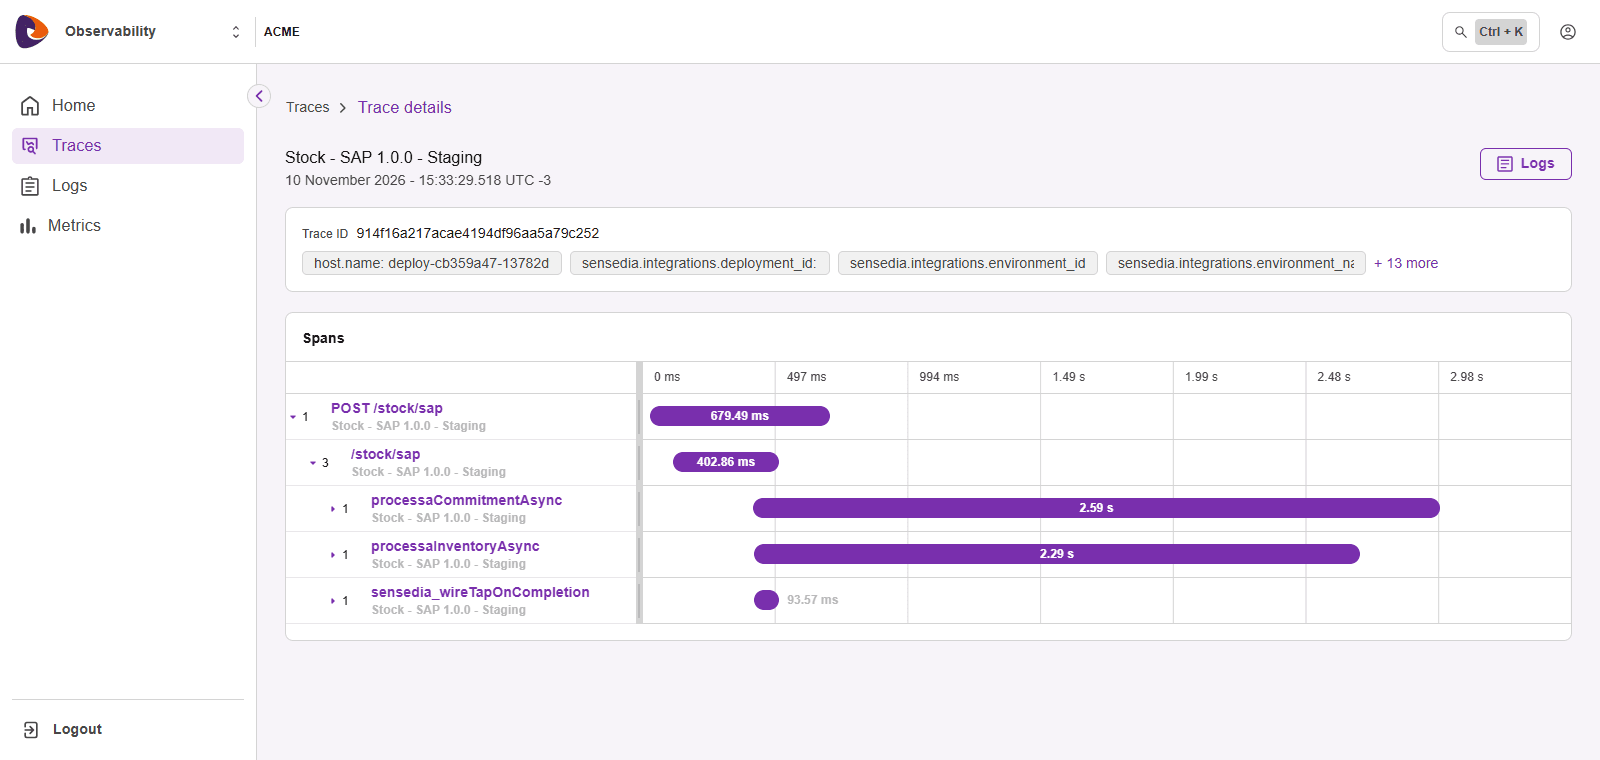
Trace summary
At the top of the screen are the service name, the start date and time, and the Logs button.
The summary card shows the Trace ID and the trace attributes, in key and value format. Click the link that ends in more, next to the attributes, to see all of them, and Show less to collapse them.
Spans
The Spans section shows the steps of the trace as a waterfall. Each row is a span:
- On the left are the span name and the service that generated it.
- On the right, the bar shows when the span started and how long it lasted, relative to the whole trace.
- The number next to the arrow indicates how many child spans it has. Click the arrow to expand or collapse the children.
With the waterfall expanded, you see which step took the most time and in what order the steps happened.
Span details
Click the name of a span to open the details panel. The header shows the span name, the service, the Trace ID, the Span ID, and the start of the span.
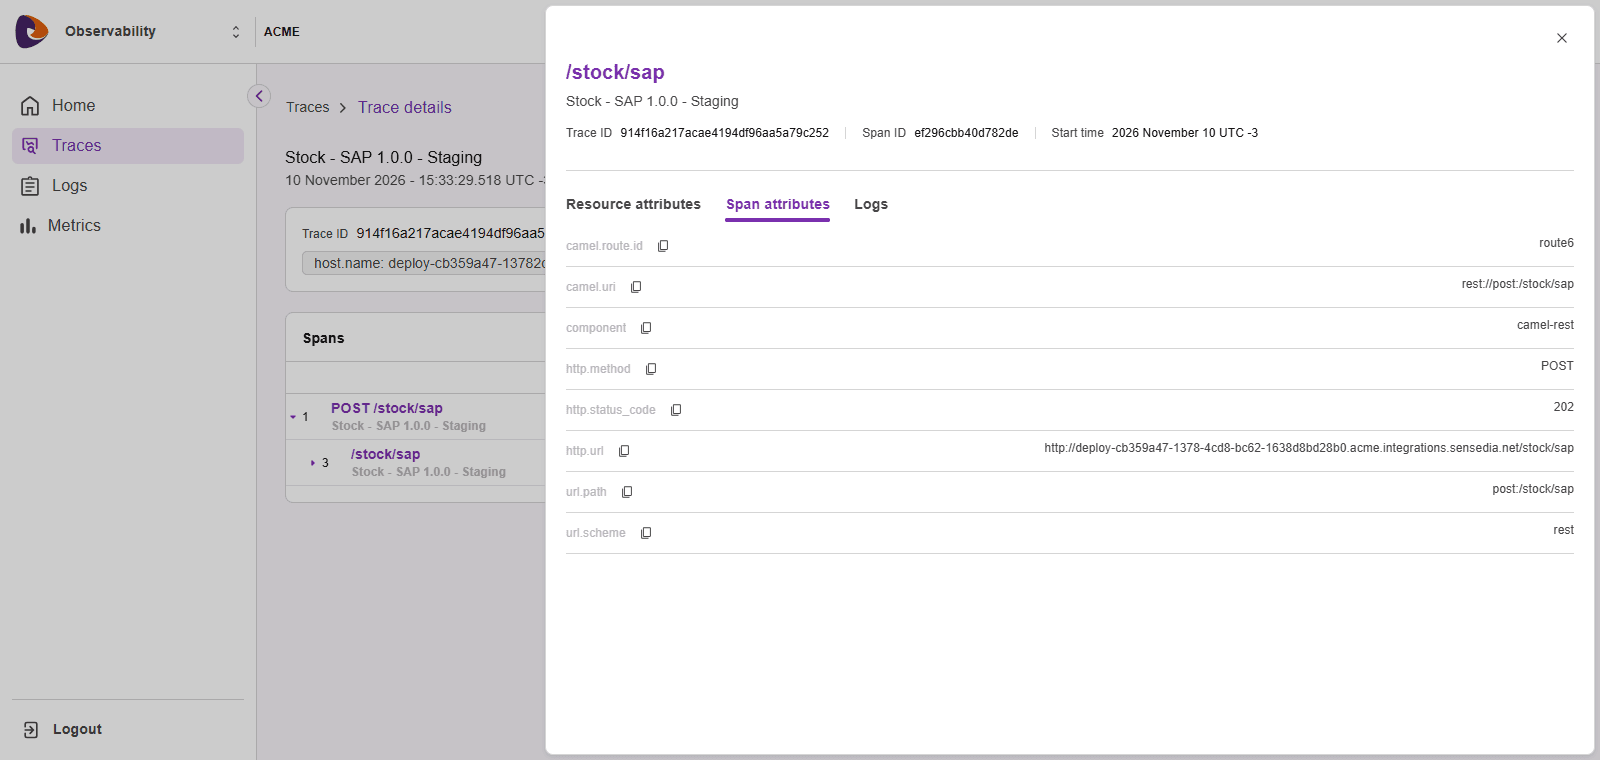
Each attribute has a button to copy the value. When the list is long, click Show more to see the rest.
Related logs
There are two ways to get to the logs of a trace:
- Logs tab of the span: lists the logs recorded in that step, with Status, Date, and Content.
- Logs button of the trace: opens the Logs screen already filtered by the trace and by the period in which it happened.
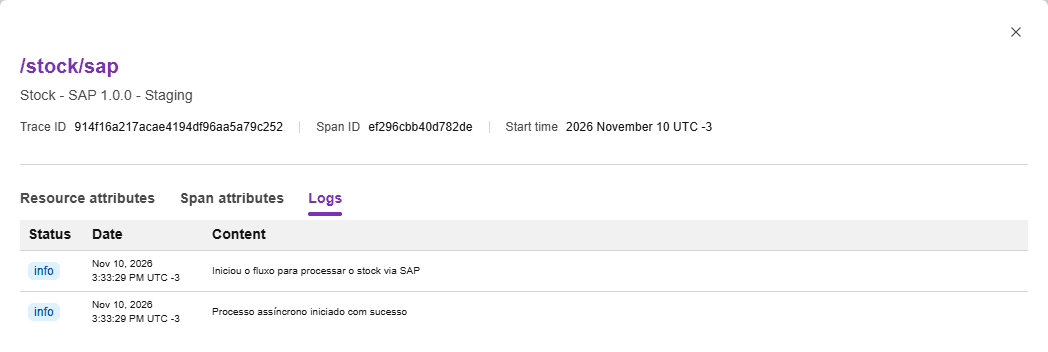
NOTEIf the span did not record any log, the Logs tab shows No logs found.