- Home
- ...
- Developer Portal
- API Status
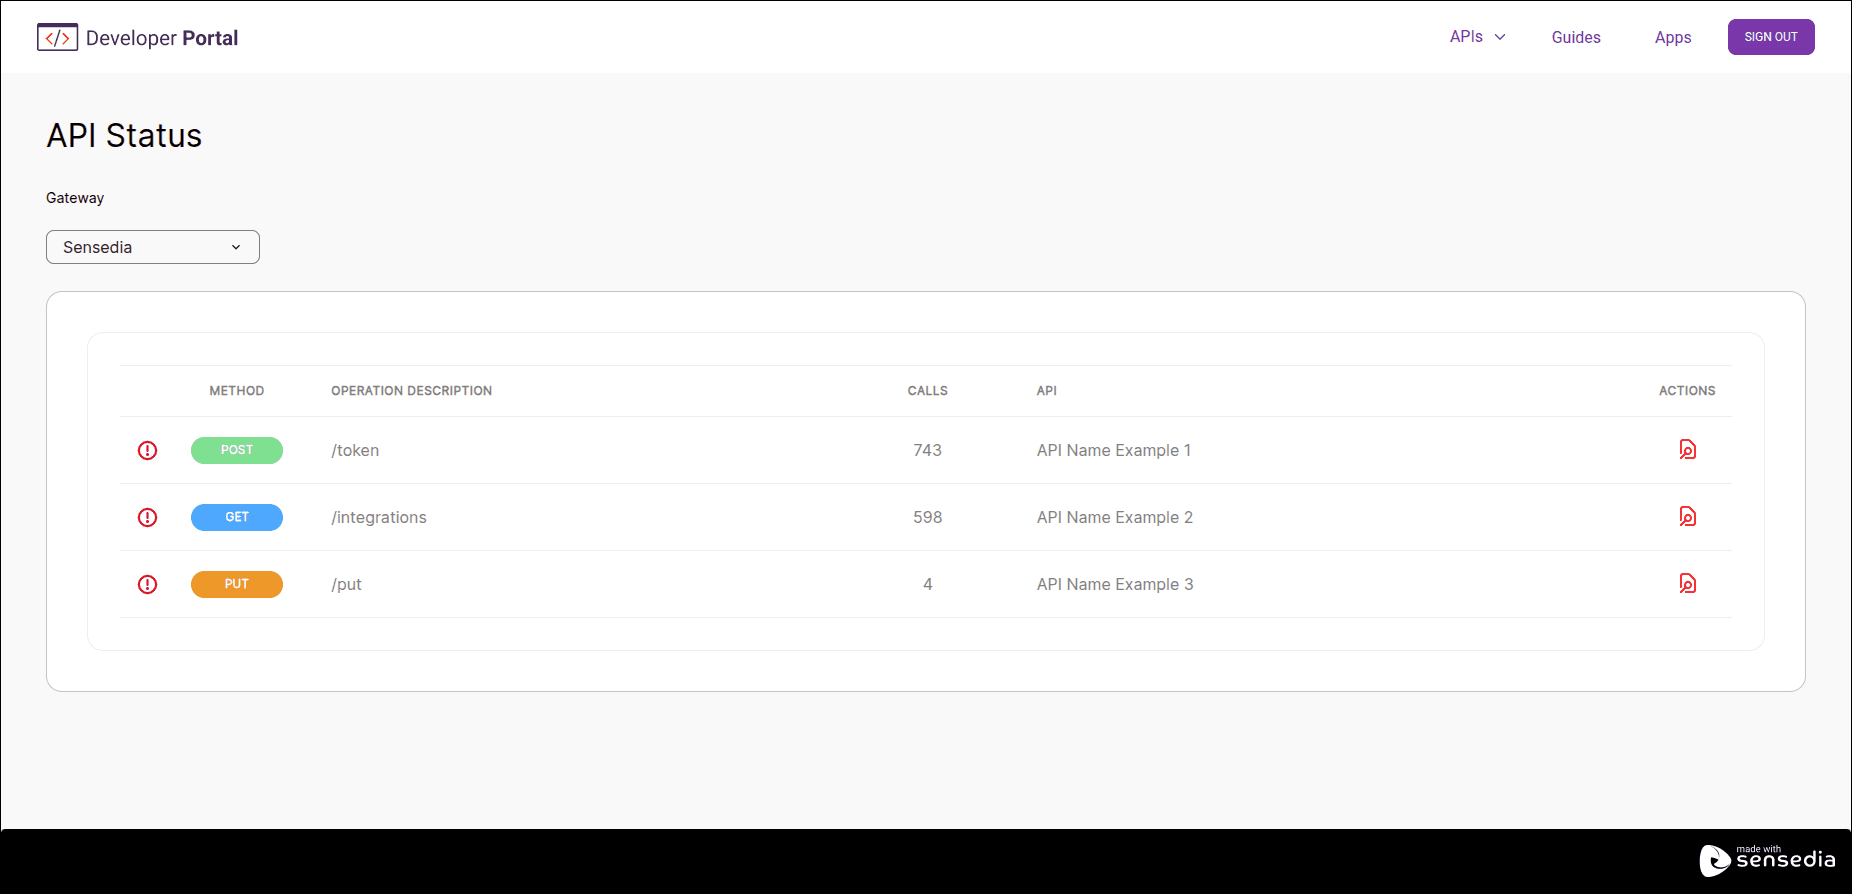
With API Status, you can check key information about the availability of your API resources in your Developer Portal.
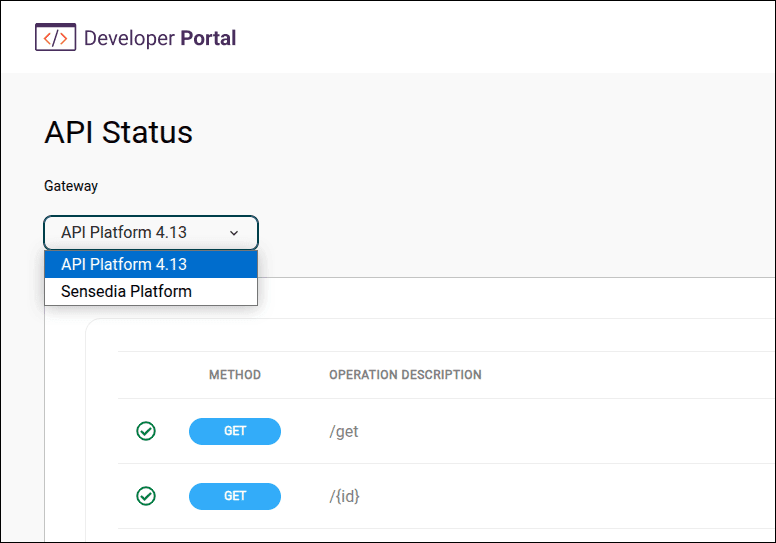
NOTEThis feature is only available for Sensedia gateways.
Accessing your API information
Follow these steps to view your API information.
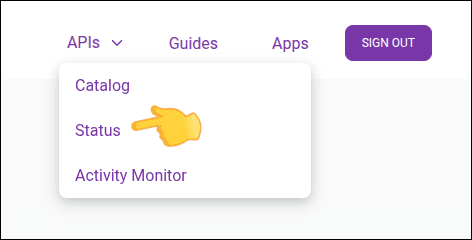
Step 1
Log in to your Developer Portal and click on the top right menu [APIs > Status]. You can also use the direct link:
https://{your-portal}/status
Step 3
Click the ![]() icon in the ACTIONS column for the desired API. See also the description of each column.
icon in the ACTIONS column for the desired API. See also the description of each column.
Step 4
The selected API's information will be displayed on the screen. See the description of the fields displayed.
NOTEYou need to be logged in to access API Status.
Table Details
The API Status screen displays a table with the following columns:
- Method: HTTP method used in the call (e.g., GET, POST, PUT, DELETE).
- Operation description: Description of the operation.
- Calls: Number of calls made.
- API: API name.
- Actions: Actions available for the selected API.
 Displays details about the selected API.
API Availability modal screen details
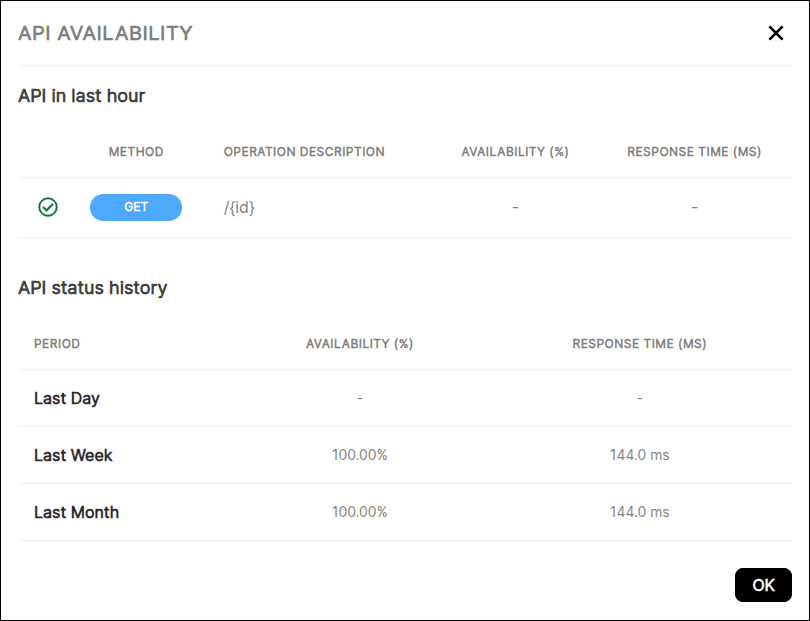
The API Availability modal screen displays the following information:
API in last hour
- (icon): API availability indicator:
 Availability greater than 90%
 Availability less than 89%
- Method: HTTP method used in the call (e.g., GET, POST, PUT, DELETE).
- Operation description: Description of the operation.
- Availability (%): API availability percentage.
- Response time (ms): Average API response time in milliseconds.
API Status - History
- Period: Time period during which the API was monitored:
- Last day: Last day
- Last week: Last week
- Last month: Last month
- Availability (%): API availability percentage.
- Response time (ms): Average API response time in milliseconds.