Health and Monitoring
You can monitor the health of your connectors. To do so, we provide an exporter for Prometheus, which generates detailed metrics information on the application.
These are the endpoints to monitor your connector:
| Endpoint | Description |
|---|---|
|
You can view info on application health, such as memory and CPU usage, error count, etc. |
|
Endpoint to check service availability. |
Monitoring tools
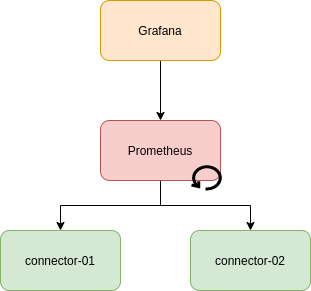
Prometheus: monitoring system for services and applications that exhibits data through queries. Prometheus searches metrics on all available instances of a connector.
Grafana: analytics tool that provides tables, charts and web alerts when connected to compatible data sources. It allows the creation of complex monitoring dashboards using queries.

You can access here the default Grafana dashboard for connectors. You can use it as it is or adapt it according to your needs.
Tracing tools
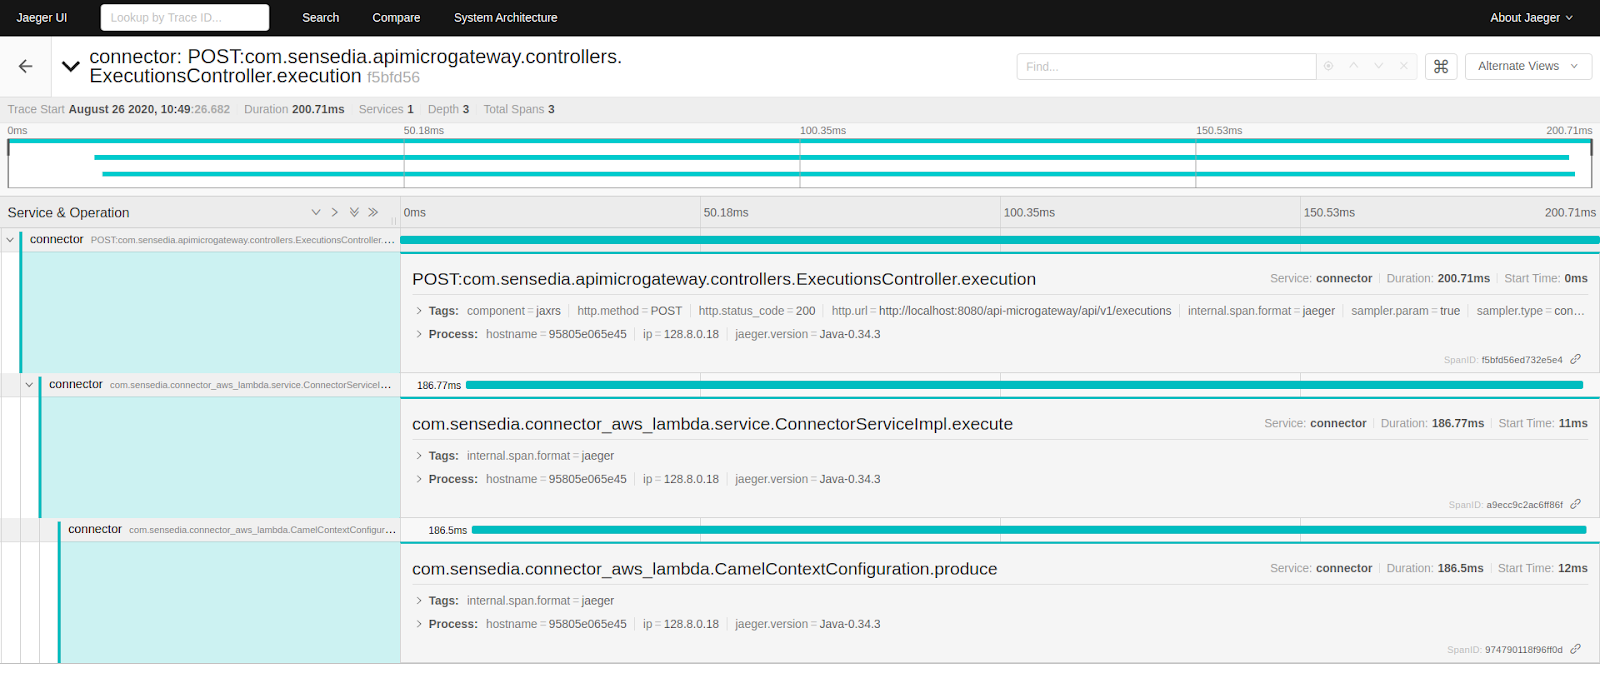
Jaeger: component responsible for storing requests that go through the connector. It allows observing every interacting that uses a connector, the time spent on executing methods, etc. The image below shows an example:

Each integration/operation is represented by a span and each span contains the execution time. When you click on a span, you can visualise the logs, as the image below shows.

You can also filter them by error, operation, time span, etc.
Grafana: component responsible for exhibiting connector metrics. It is highly recommended for performance analyses and error monitoring, among others. This is an example:

Share your suggestions with us!
Click here and then [+ Submit idea]