Thanks for your feedback!
EDIT
The Impact Analysis feature () displays a graphical visualisation of an API’s integration network. It has two main goals:
to mitigate problems related to changes in APIs and/or their dependencies;
to provide a clear view of the points to be altered in order to attain a given objective.
It manages to that by analysing the integration network within the API Platform formed by an API. The result is a graphical visualisation that can be explored, representing the applications and plans that consume an API and the resources and endpoints it provides access to. With that, you can perceive the impact that will be caused by changes in an API or parts of the network it integrates.
To generate the graphical visualisation, you must first inform the API you want to see and the environment it is deployed to.
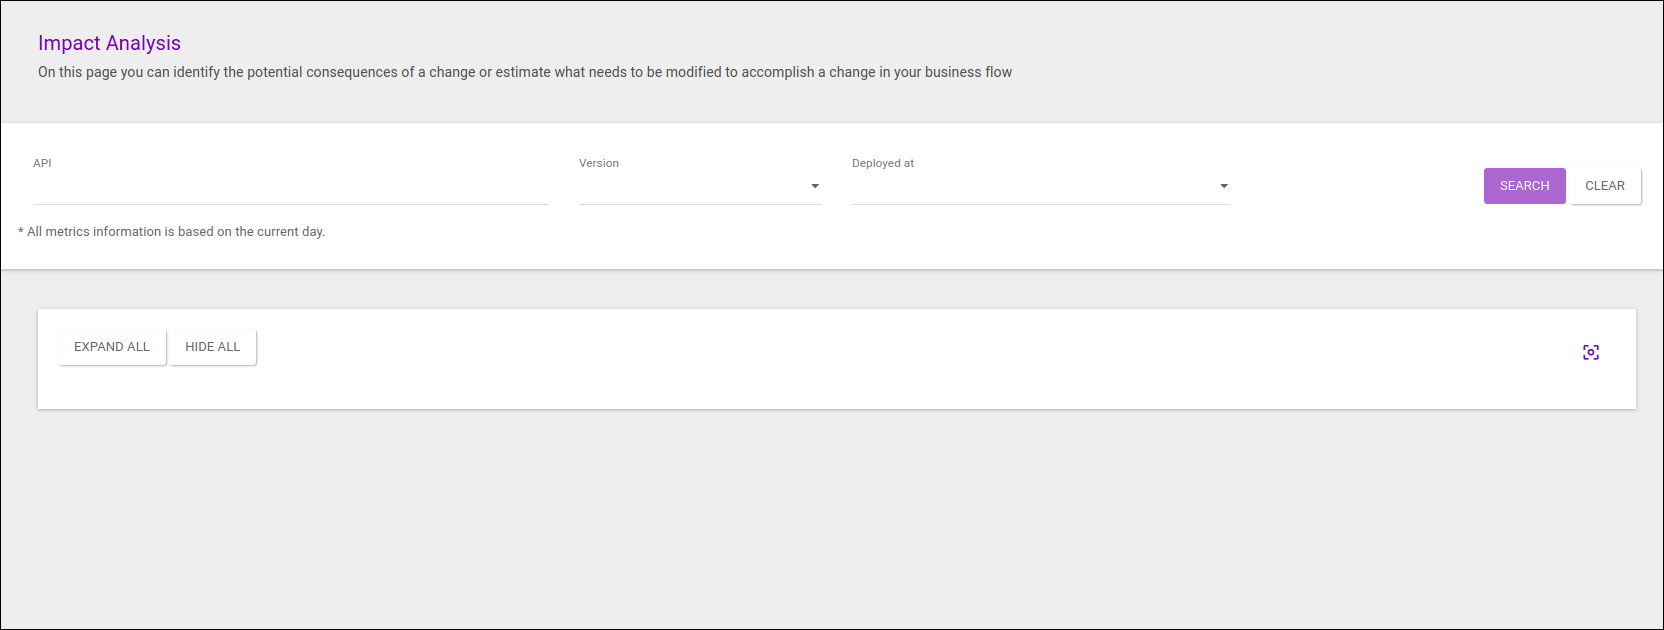
| Impact Analysis only collects runtime information — that is, from APIs that are deployed in the selected environment. You can’t perform impact analysis on APIs that have not yet been deployed. |
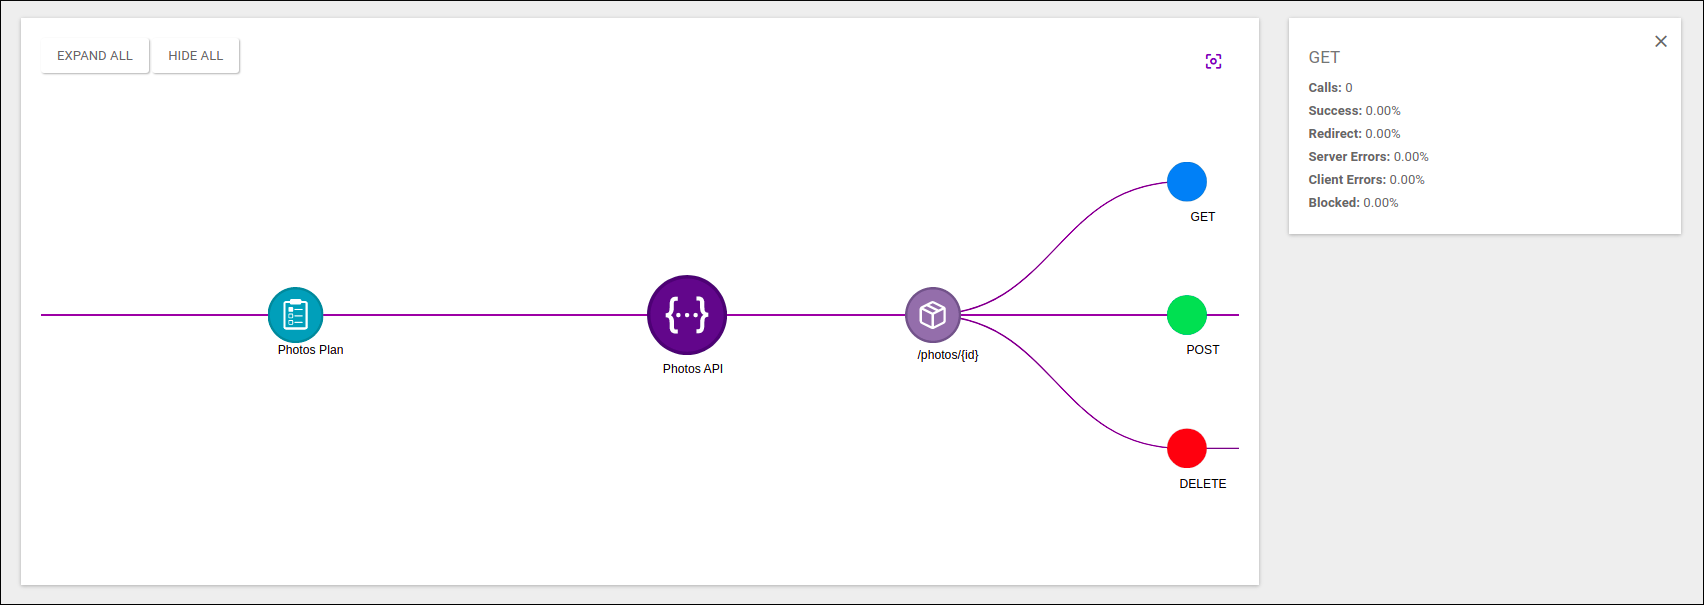
After you inform the API, the version, the environment, and click SEARCH, a graph such as the one below will be displayed, representing the API as the root node at the centre, the plans that allow consuming it on the left, and its resources to the right.
| In versions prior to 4.6.2.0, the version drop-down list is not active. |
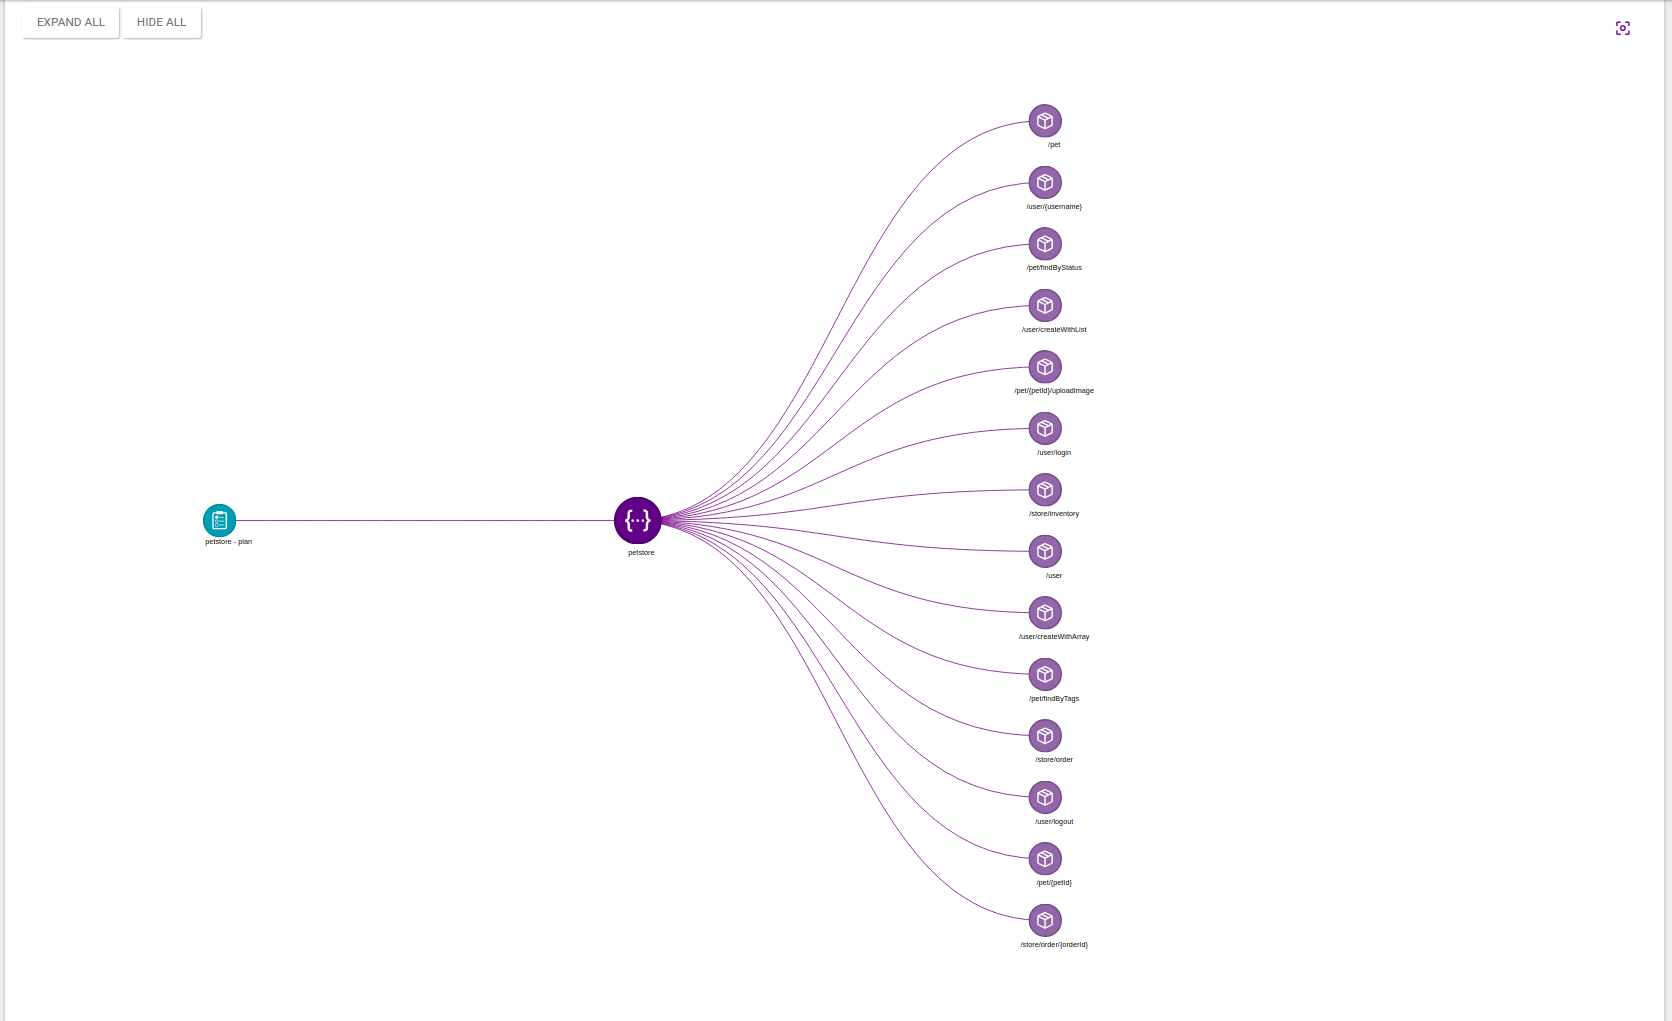
You can click on each node, expanding the visual information. When you click on resources, you can see their operations and destinations; if you click on plans, the graph will show the apps that can access the API. Instead of clicking on each node to expand the information bit by bit, you can also display all the content available at once by clicking the button EXPAND ALL, above the graph and to its left. To simplify the graph again, showing only the plans and resources, click on HIDE ALL.
In the example below, which is less complex than the image above, we’re showing the expanded graph for an API called "Photos API":
The graph also displays volume data regarding APIs and operations in a window to the right when you click on the nodes:
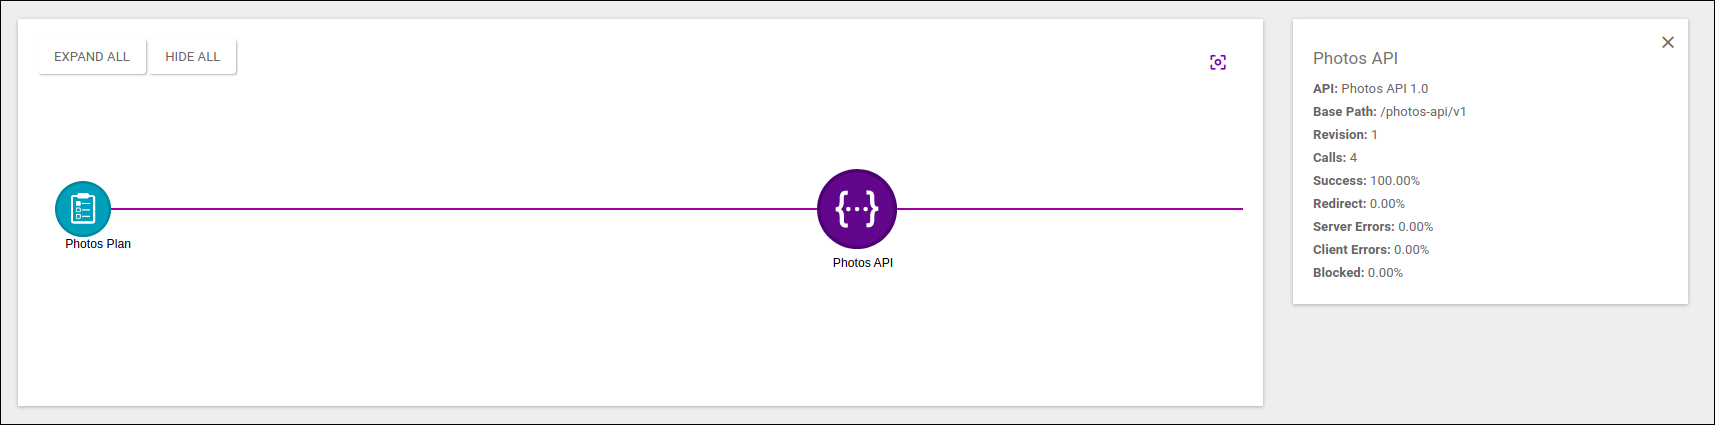
| The metrics refer to the current day. |
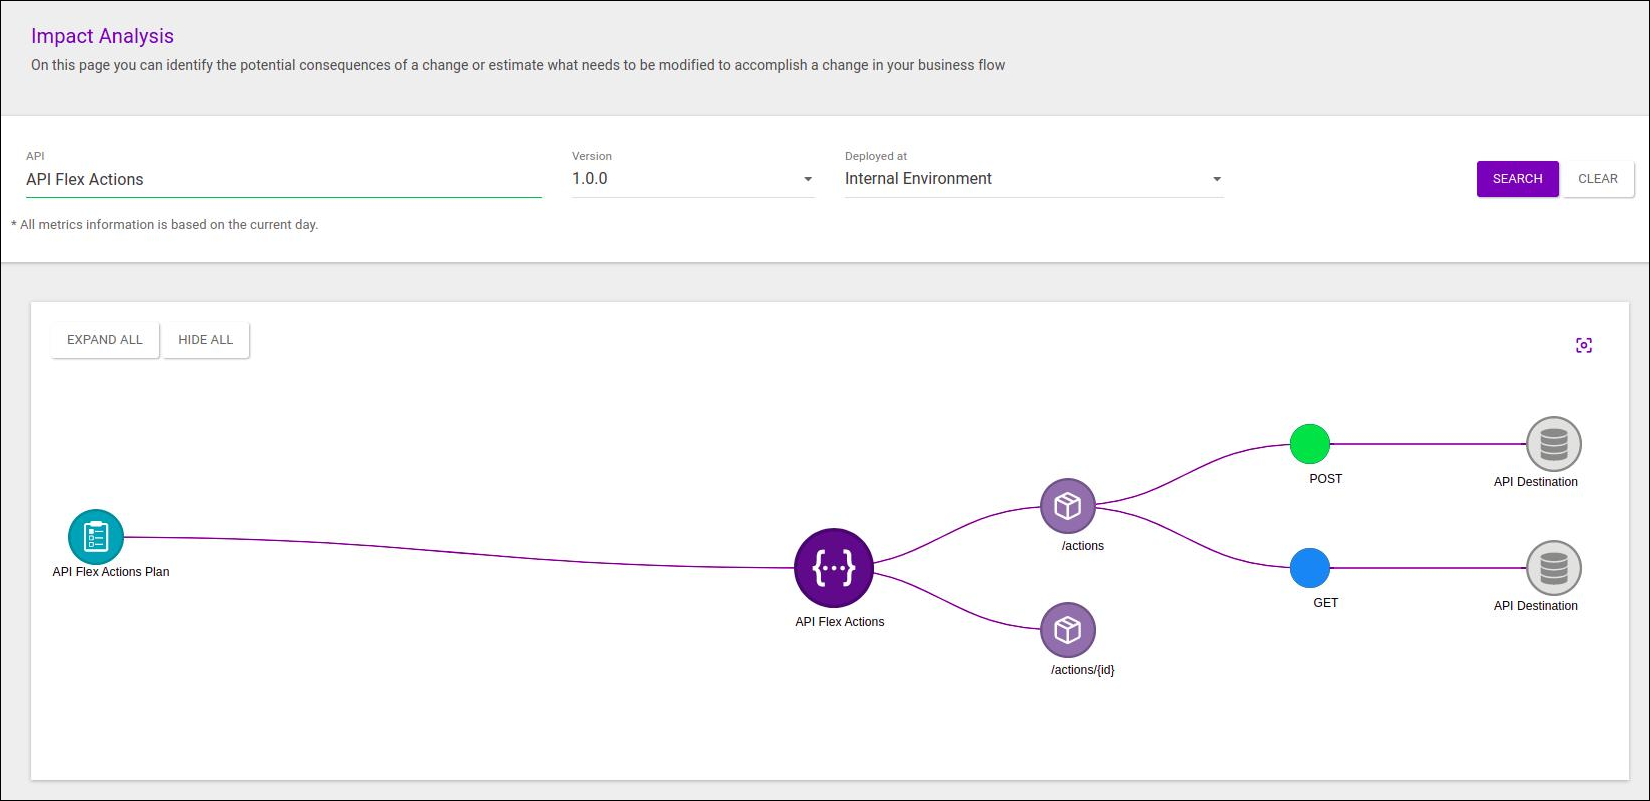
When you click on the destination nodes, you can view in a window to the right the resource endpoints:
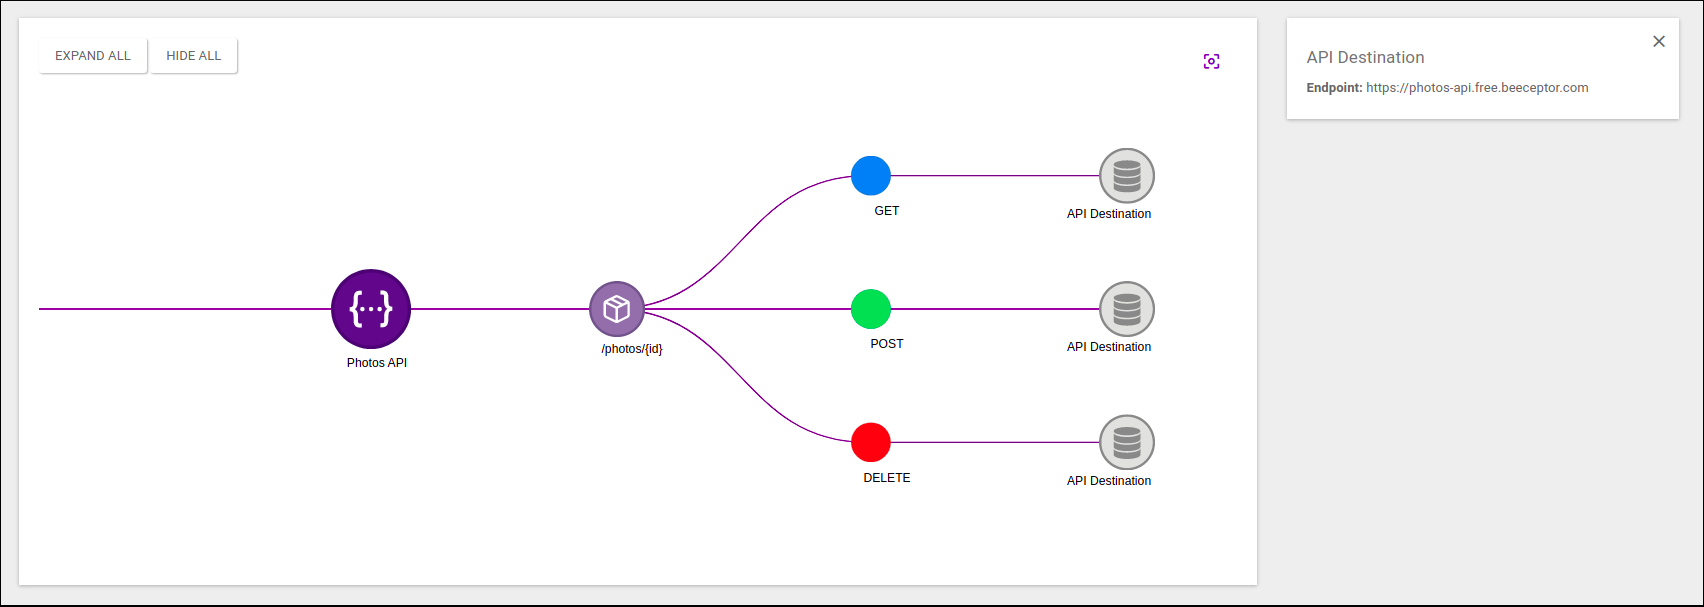
Note that, regarding the destination nodes, the API Manager interprets the API destinations and the interceptors Internal API Call, Service Callout and Custom JavaScript with calls using the component $http.
|
In versions prior to 4.6.1.0, metrics and endpoint information is displayed when you hover the cursor over the nodes: 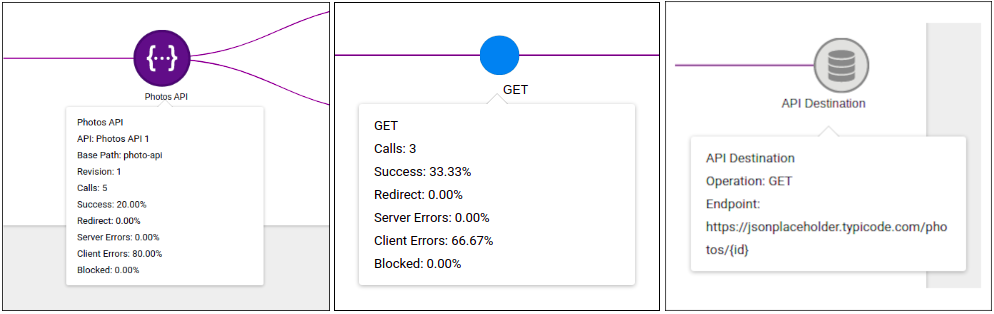
|
Share your suggestions with us!
Click here and then [+ Submit idea]