Thanks for your feedback!
EDIT
The Impact Analysis feature displays a graphical visualization of an API’s integration network. It has two main goals:
to mitigate problems related to changes in APIs and/or their dependencies;
to provide a clear view of the points to be altered in order to attain a given objective.
This is done by analyzing the entire integration network within Sensedia API Platform from an API. The result is a graphical visualization that can be explored, representing the applications and plans that consume an API and the resources and endpoints it provides access to. With that, you can keep in mind the impact that will be caused by changes in an API or in parts of the network it integrates.
The Impact Analysis screen is accessible from the Sensedia Adaptive Governance main menu.
To generate the graphical visualization, you must first enter the following data about the API to be analyzed into the fields located at the top of the screen:
API: Name of the API to be analyzed;
Version: The version to be analyzed;
Deployed at: The environment to which it is deployed.
After filling in the fields and clicking SEARCH, a graph such as the one below will be displayed, representing the API as the root node at the center, the plans that allow consuming it on the left, and its resources to the right.
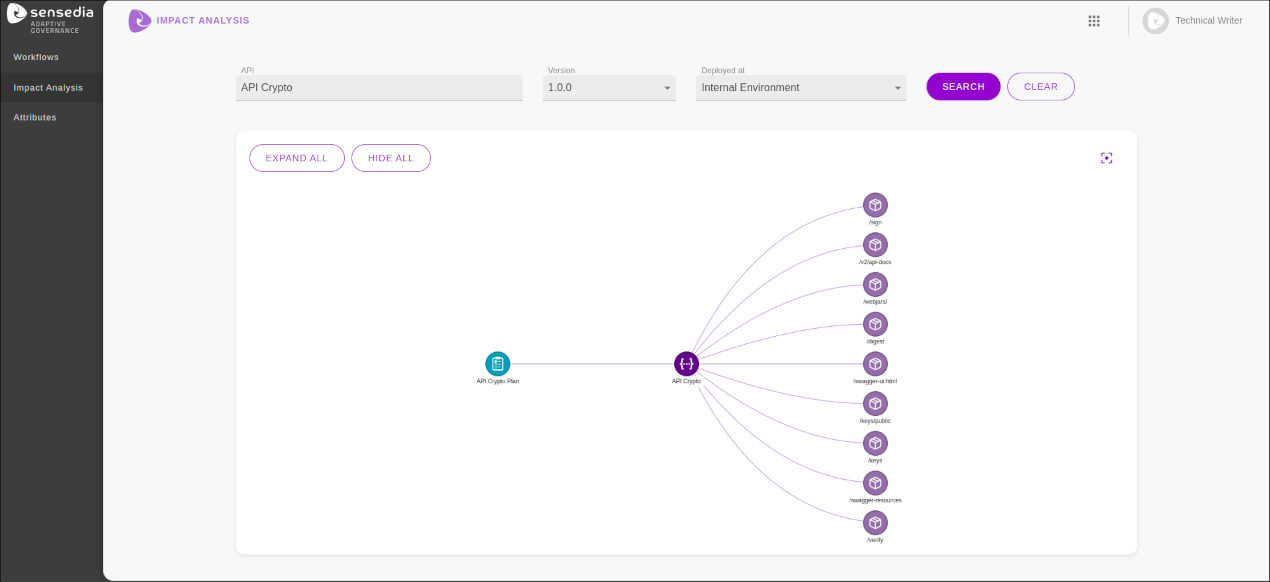
| Impact Analysis only collects runtime information — that is, from APIs that are deployed in the selected environment. You can’t perform impact analysis on APIs that have not yet been deployed. |
The CLEAR button, located next to the SEARCH button, allows you to clear the screen information (entered data and graph).
You can interact with the displayed graph in several ways.
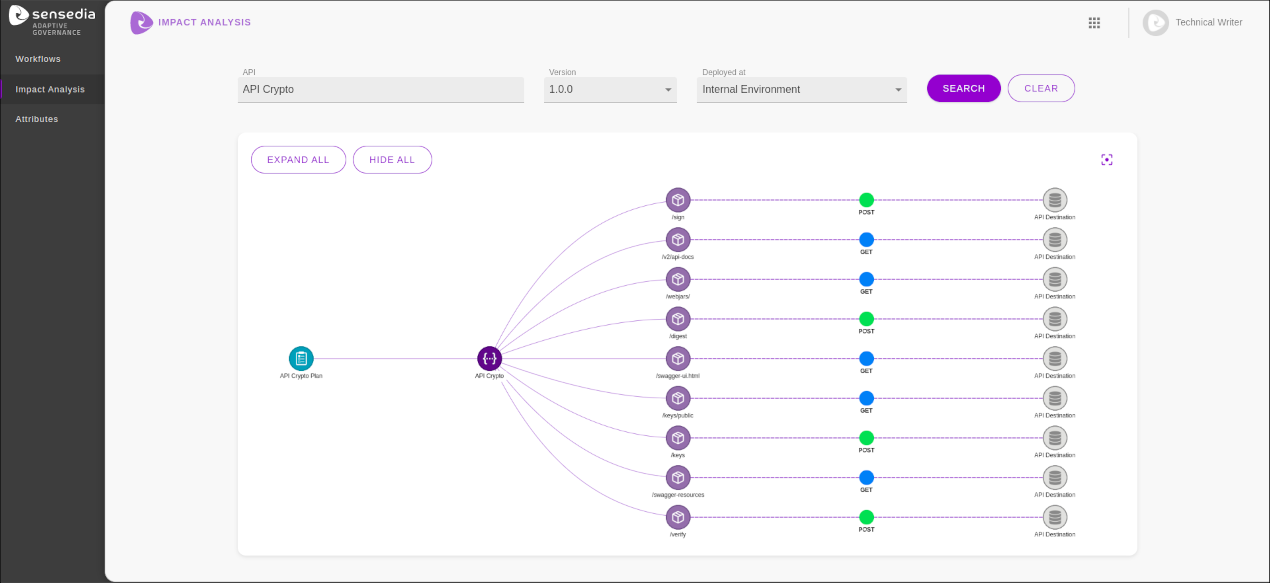
By clicking on a node with the left mouse button, it is possible to expand it and view additional information related to it. When you expand a node corresponding to a resource, you can see its operations and destinations. If you expand the nodes corresponding to the plans, the graph will show the apps that can access the API.
It is also possible to expand all nodes of the graph with available content at once by clicking the EXPAND ALL button, located in the top left corner of the graph. To simplify the graph again, showing only the plans and resources, click on HIDE ALL.
The graph can also be repositioned on the screen.
For that, click with the left mouse button on the screen and drag the graph to the desired position.
To center it again, click the ![]() button, located in the upper right corner.
In addition, you can zoom in and out of the graph with the mouse scroll wheel.
button, located in the upper right corner.
In addition, you can zoom in and out of the graph with the mouse scroll wheel.
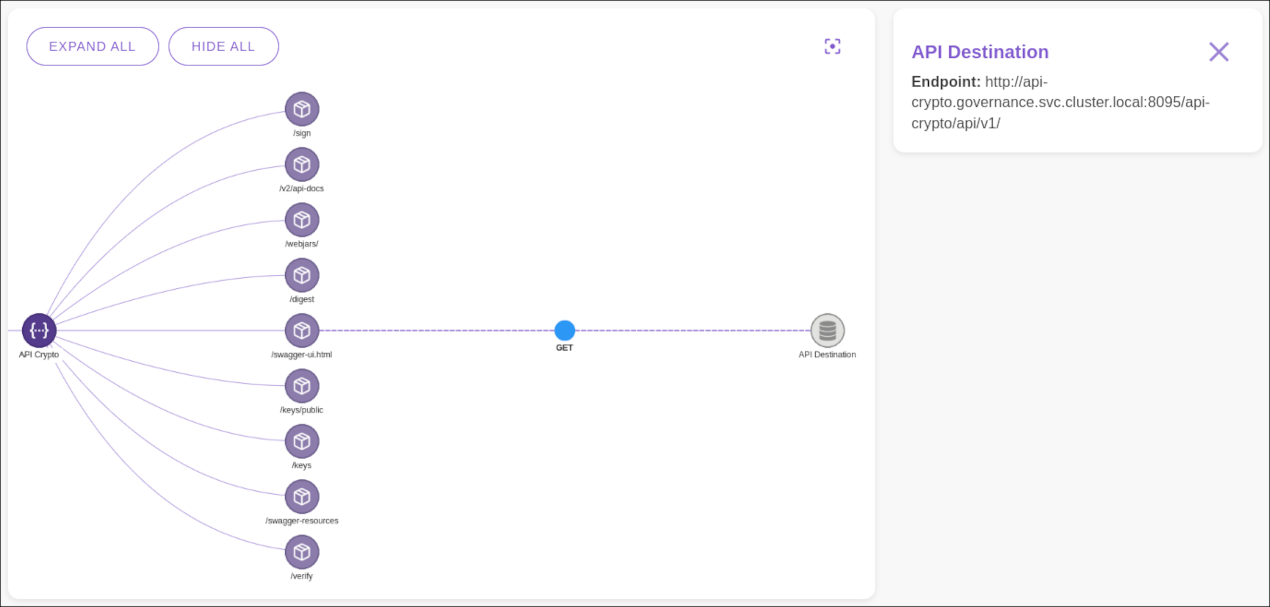
The example below shows the expanded graph for an API called "API Crypto":
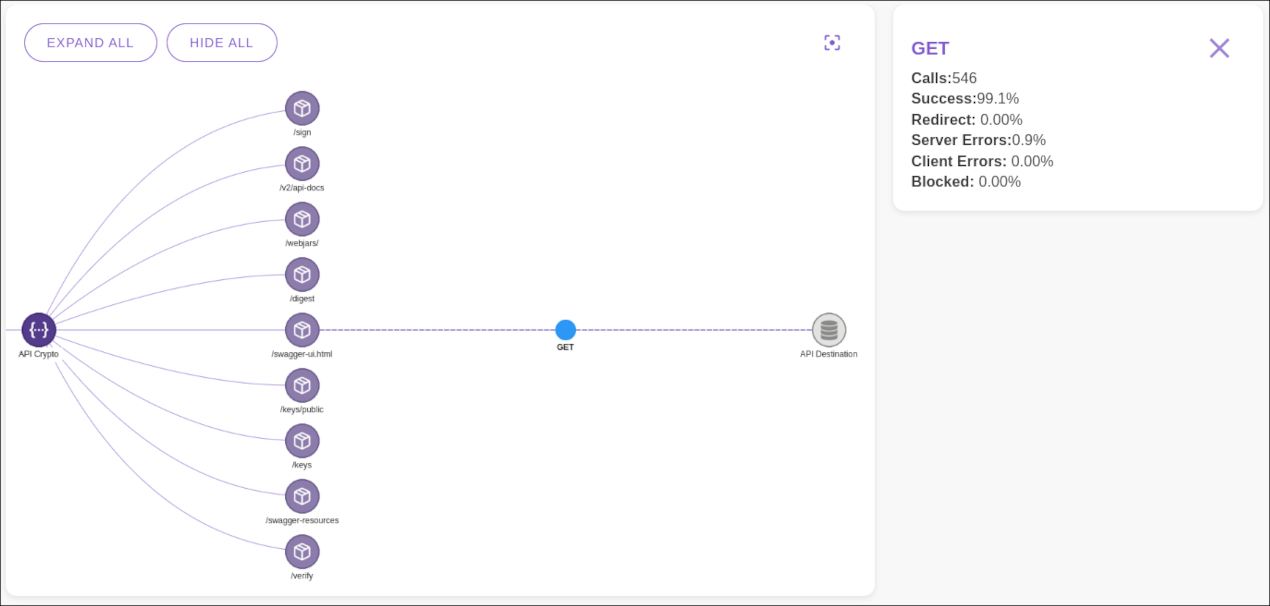
The graph also displays volume data for the APIs, apps, and operations nodes. To view the metrics, right-click the desired node.
The following metrics are displayed:
Calls: total calls received;
Success: percentage of calls that had a response with an HTTP status code between 200 and 299;
Redirect: percentage of calls that had a response with an HTTP status code between 300 and 399;
Server Errors: percentage of calls that had a response with an HTTP status code between 500 and 599;
Client Errors: percentage of calls that had a response with an HTTP status code between 400 and 499 (with the exception of codes 413 and 429, which are classified as Blocked);
Blocked: percentage of calls that had a response with the HTTP status codes 413 or 429.
The data are displayed in a window to the right of the graph, as shown in the following figures:
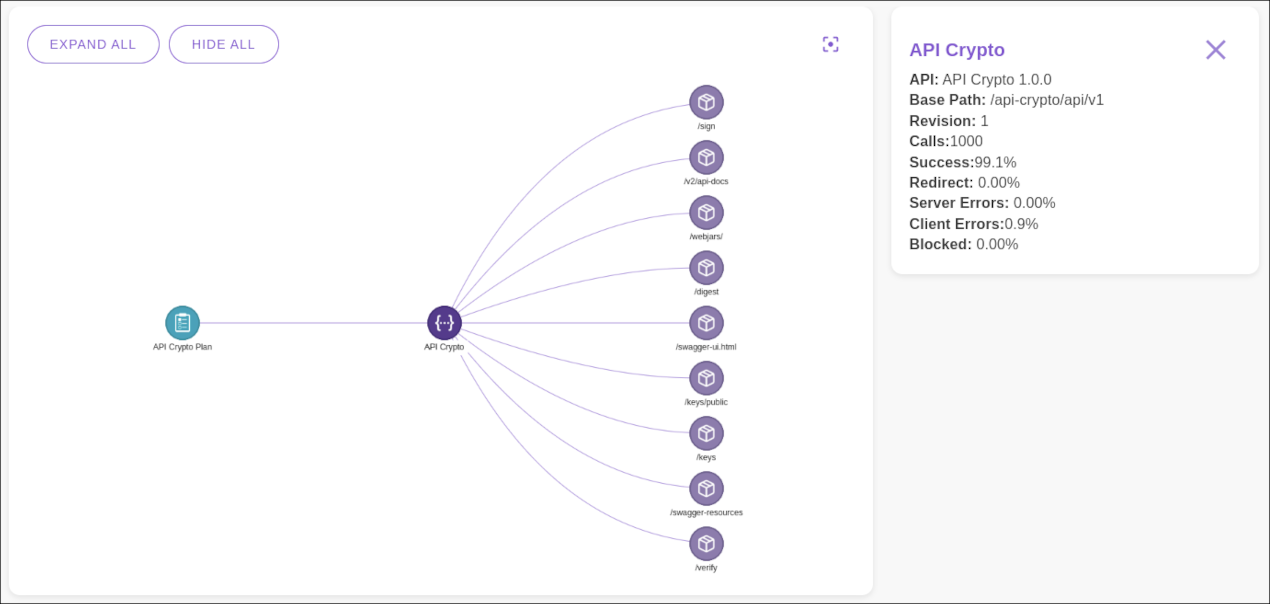
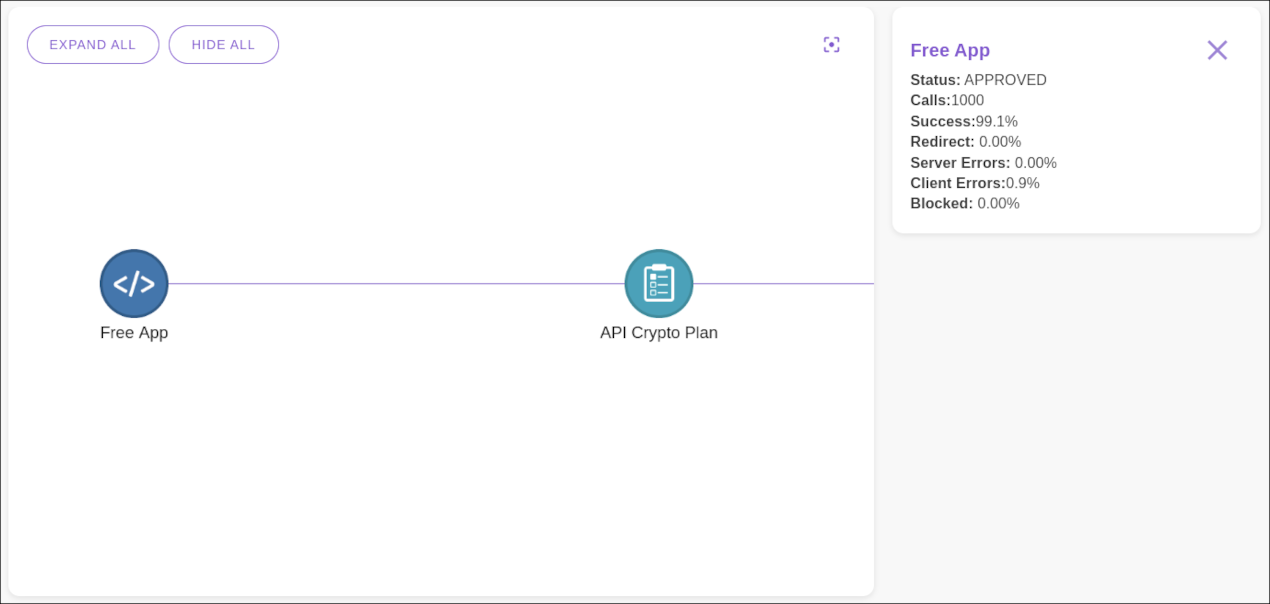
| The metrics refer to the current day. |
Likewise, when you click on the destination nodes, you can see, also in a window to the right, the resource endpoints:
Share your suggestions with us!
Click here and then [+ Submit idea]