Thanks for your feedback!
EDIT
Follow the steps below to create a visualization.
Watch the videos below with examples on how to create visualizations.
The first video shows how to create a visualization using a bar graph to display calls by status code:
|
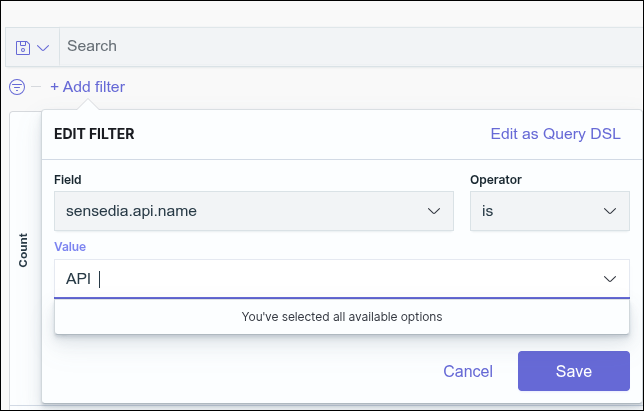
When adding a filter, for field values to be displayed in search autocomplete, they must reach a minimum volume of requests. For example, if an API name is changed, the new name will only be suggested in autocomplete after a sufficient number of searches using this new value.
|
Watch next how to create a visualization using pie chart and line graph:
| For the filter type aggregation, remember to choose the correct syntax — Lucene or DQL — before writing your query. |
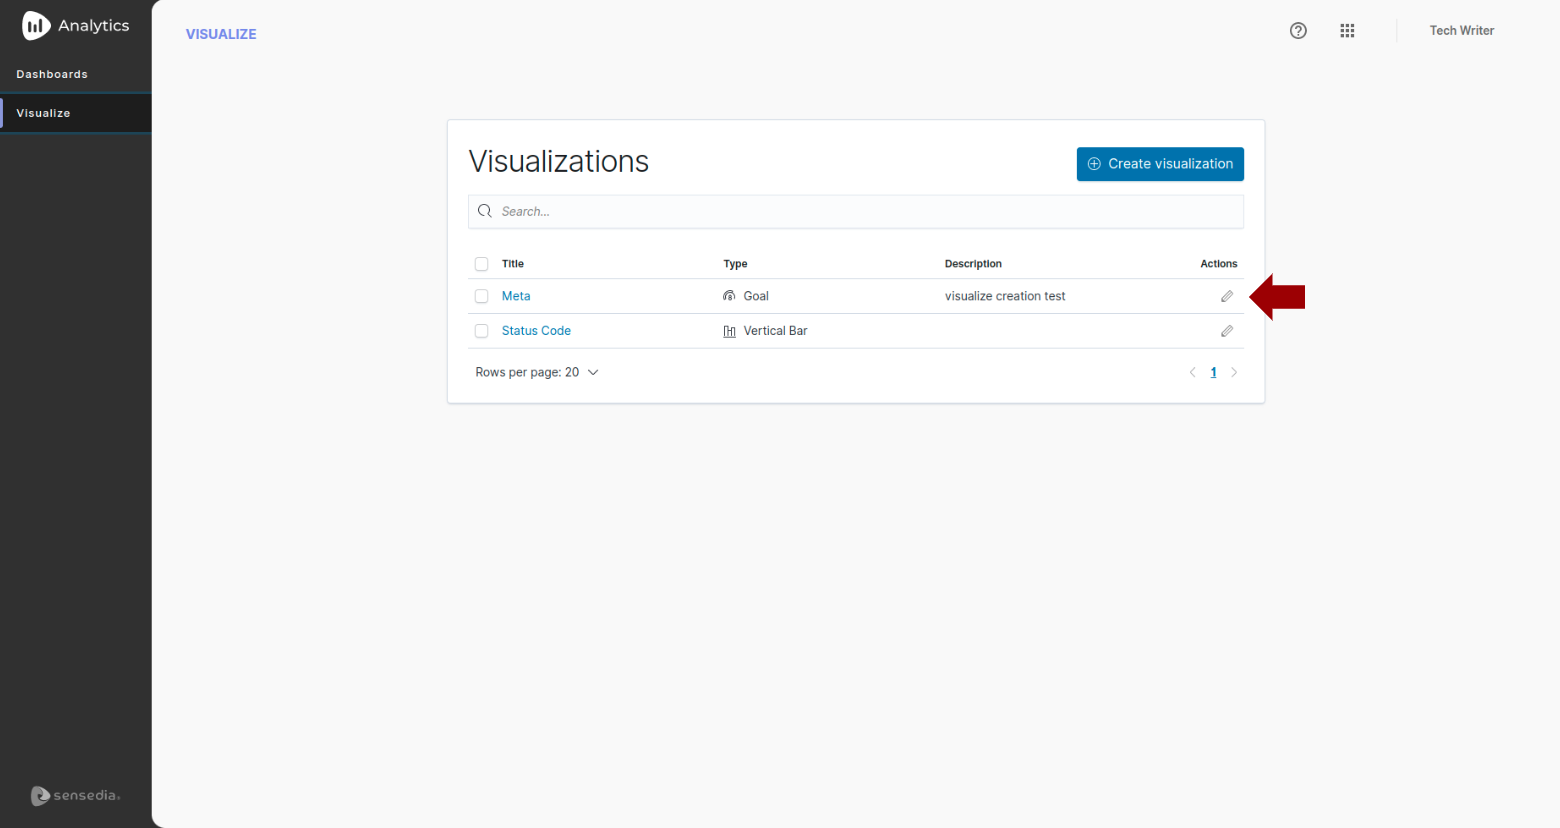
Saved visualizations are listed on the Visualize home screen.
To edit, click on the ![]() icon, in the Actions column (indicated by a red arrow in the figure below).
icon, in the Actions column (indicated by a red arrow in the figure below).
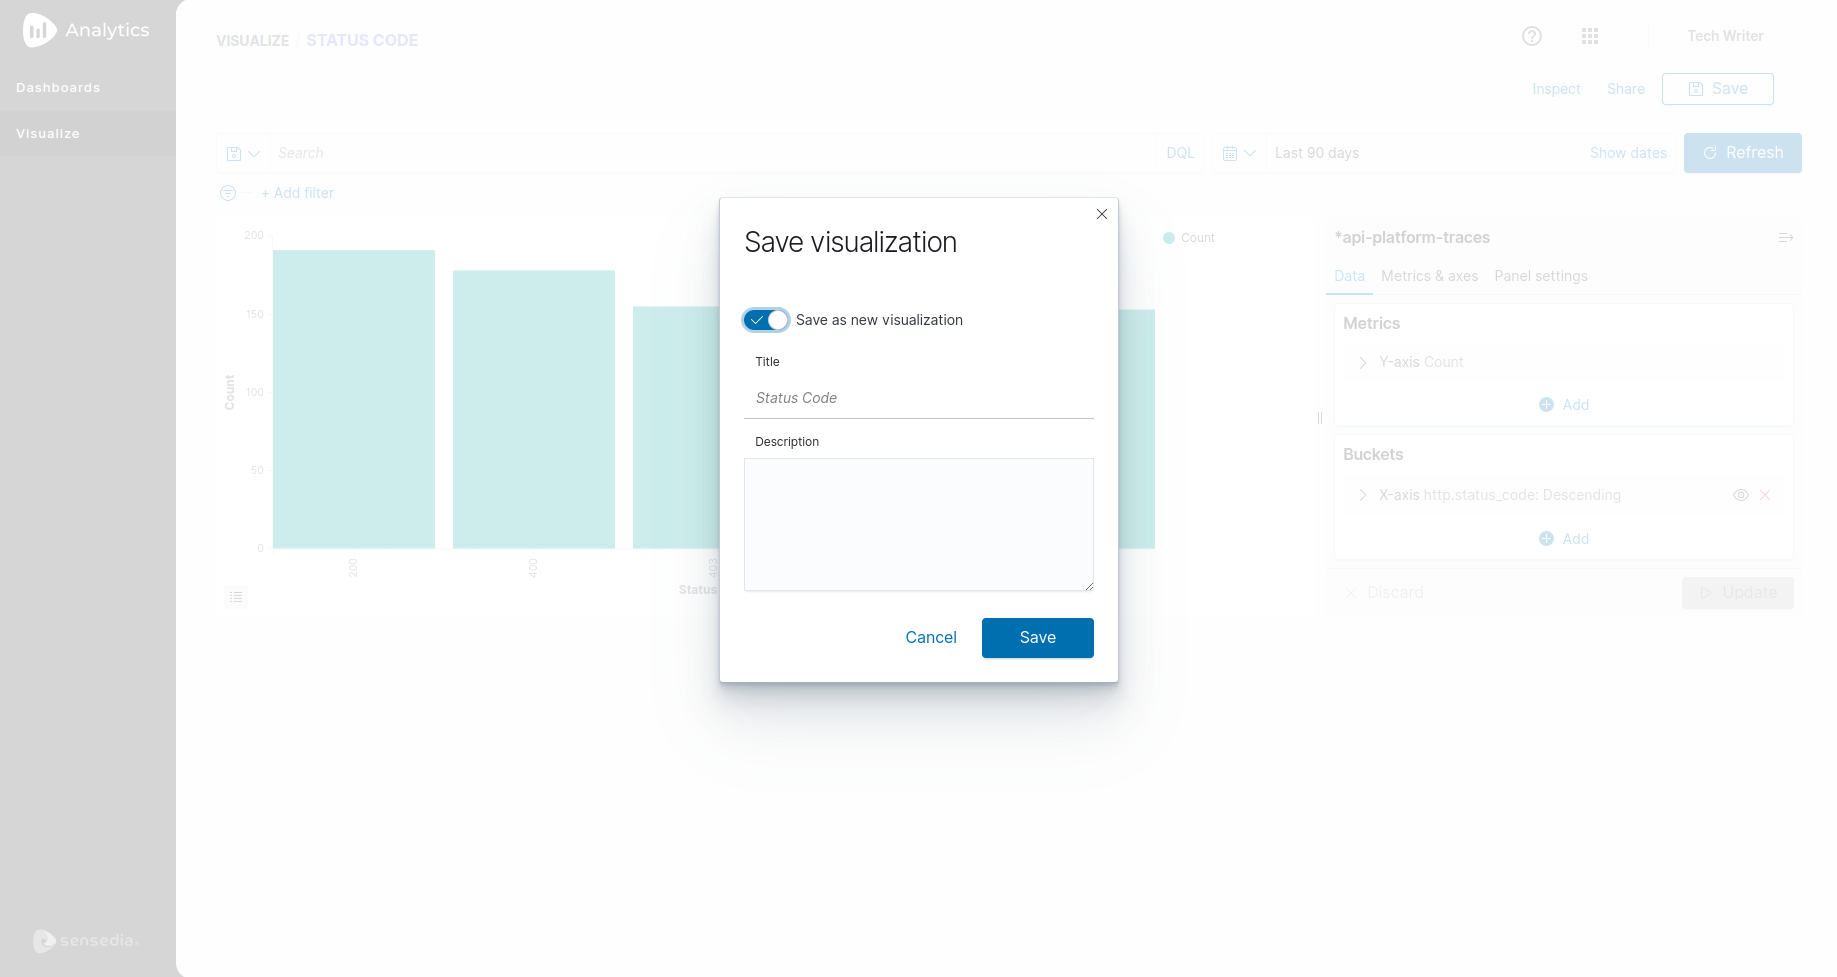
After editing, you can save changes to the existing file or save as a new visualization. To save it as a new visualization, click the SAVE button and, on the screen that opens, click Save as new visualization, as shown in the image below.
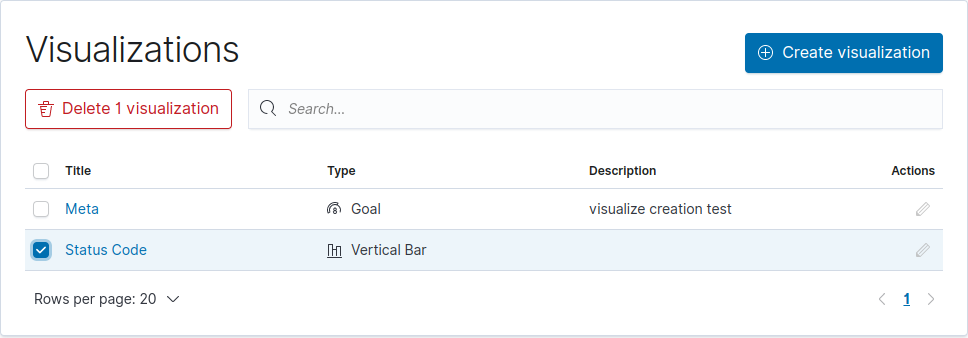
From the list of visualizations, select the one you want to delete. You can select more than one.
When at least one is selected, a new button, lettered in red, will appear on the screen. See image below. Click Delete 1 visualization to delete the visualization. The number that appears on the button varies according to the number of visualizations selected.
Confirm the visualizations that will be deleted by clicking Delete
 .
.
| Deleted views cannot be recovered. |
Share your suggestions with us!
Click here and then [+ Submit idea]