
Thanks for your feedback!
EDIT
|
Quick links:
With General trace, you can explore large amounts of data and exam them closely. You can choose the time intervals for your queries and save your searches. The results can be used to create visualizations for more clear comprehension.
Looking at the graphs and documents details, you may find answers to questions like: what were the most recent events? Which process is taking longer?
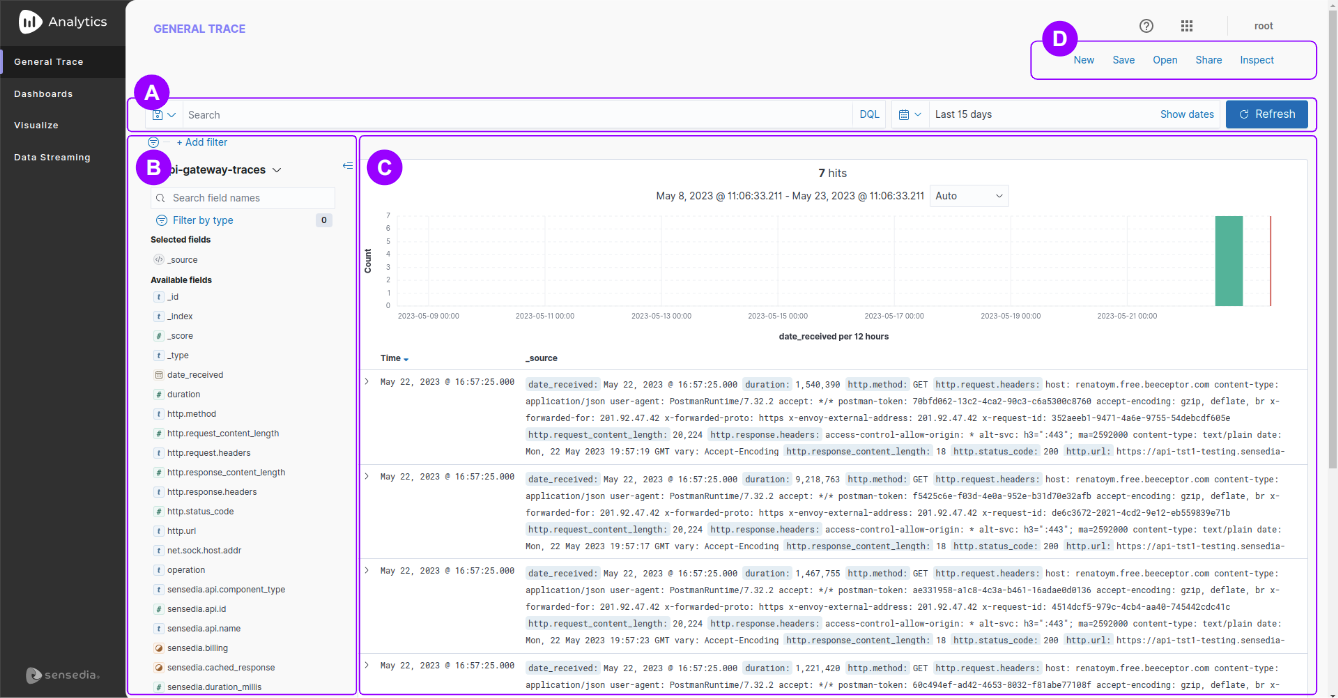
The General trace screen has four main parts:
A The horizontal bar, located at the top of the screen, hosts the area destined to perform searches;
B The vertical bar, located on the left side of the screen, displays a field list and a drop-down menu with the index pattern used;
C The central area is intended for the display of search results.
D The menu located in the upper right corner of the screen is specific to this General trace screen.
| The index patterns Metrics and Calls, from previous versions, have been replaced and updated, respectively. See the fields mapping for the Calls and Traces indexes. |
See how to access General Trace in the video below:
You can retrieve a saved search expression by clicking on image:save.png [disket symbolizing the act of saving the search]. The same icon is used to save the current expression.
The search can be performed using Lucene or DQL (OpenSearch Dashboard Query Language). Click Lucene or DQL to select which syntax you prefer to use.
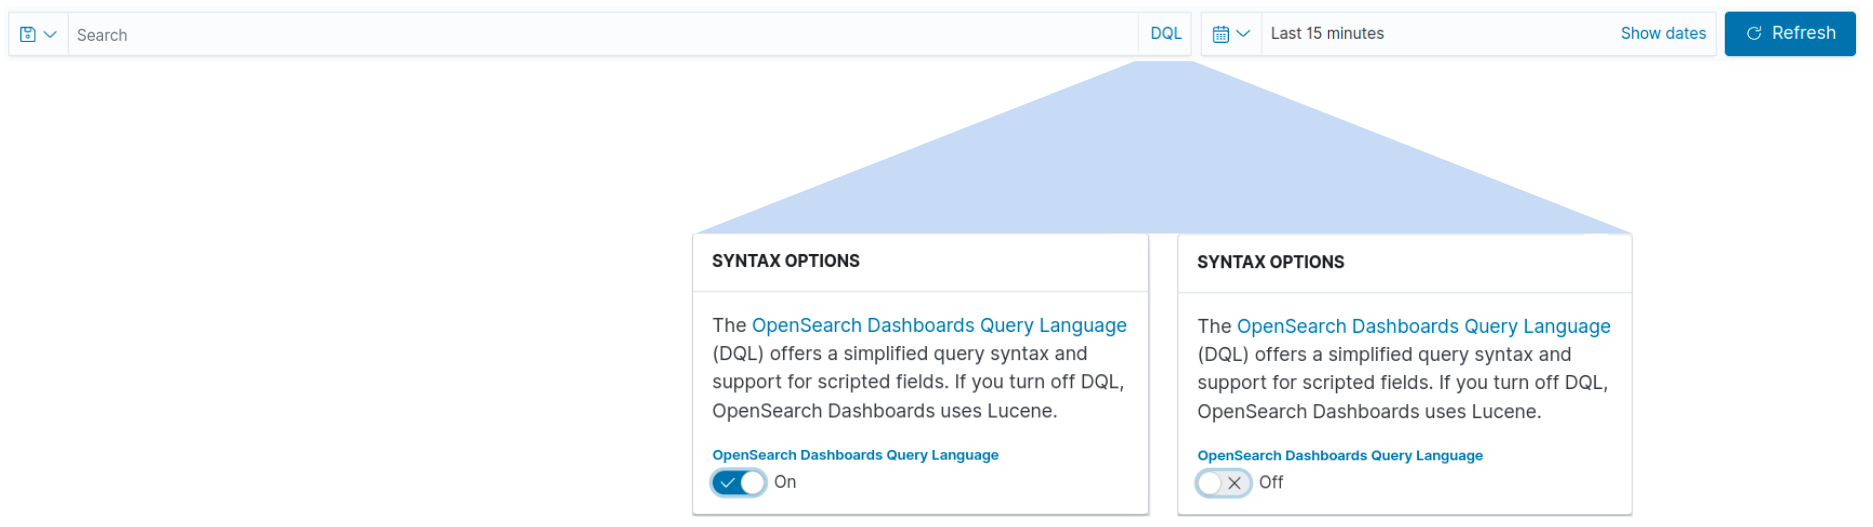
As examples of accepted search terms: keywords, key values, conjunctions AND, OR, NOT, etc.
For example, the query below retrieves all status codes between 400 and 499 with php extension:
status:[400 TO 499] AND extension:PHP
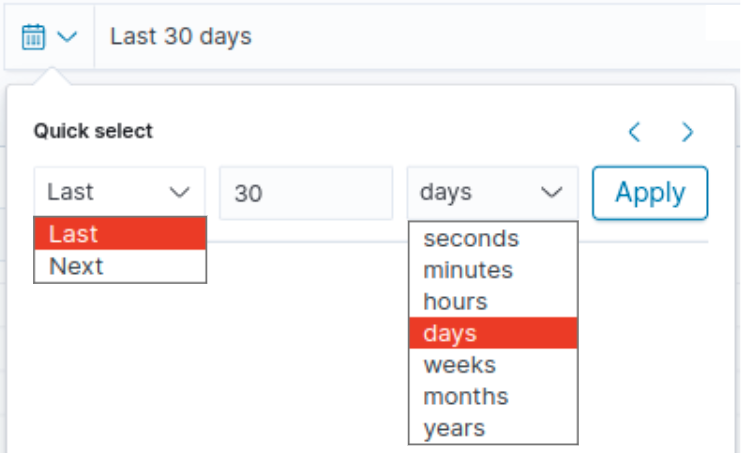
To set a time range, click  .
The default is set at 15 minutes.
.
The default is set at 15 minutes.
Select one of the options:
Quick select: set a time range by determining a numerical value and selecting which range (last or next) and time unit (seconds, minutes, hours, days, weeks, months or years).
Commonly used: select from commonly used options such as Today, Last 15 minutes, etc.
Recently used: Use recently selected ranges.
Refresh every: Specify the refresh frequency in seconds, minutes, or hours.
|
The minimum recommended time for refreshing (refresh every) Dashboards is 30 seconds. |
Another option is to determine specific start and end values. To do this, click Show dates. Then select Absolute, Relative or Now and provide the corresponding information.
See more details about the search bar and filter creation in the video below:
|
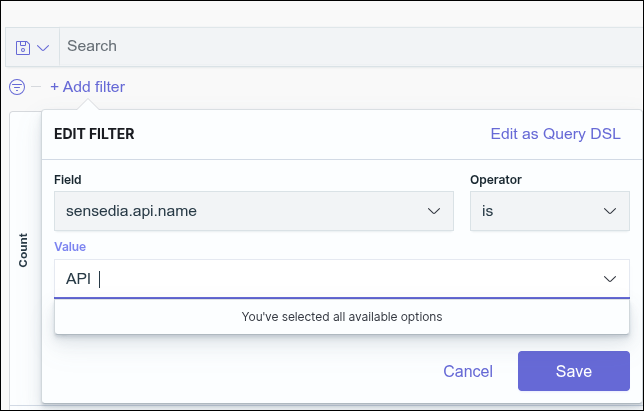
For field values to be displayed in search autocomplete, they must reach a minimum volume of requests. For example, if an API name is changed, the new name will only be suggested in autocomplete after a sufficient number of searches using this new value.
|
The index pattern defines which indexes you want to analyze, that is, from which indexes the data will be retrieved.
It is common to store data in different indexes. In General Trace, the data is stored in two indexes:
In addition to basic call information, it also contains data from trace headers and payload (request and response body, if any). This information is kept for a maximum of 7 days or as per the contracted storage plan.
|
To create queries or charts using information from the trace’s headers or its payload, use the Calls Index. Please note that the data retention period is shorter in the Calls index. See the table below. |
At the top of the search result display area there is a histogram, which displays data ingestion over time.
The histogram visually summarizes the data, making it easy to compare results. You can explore the chart to see more details.
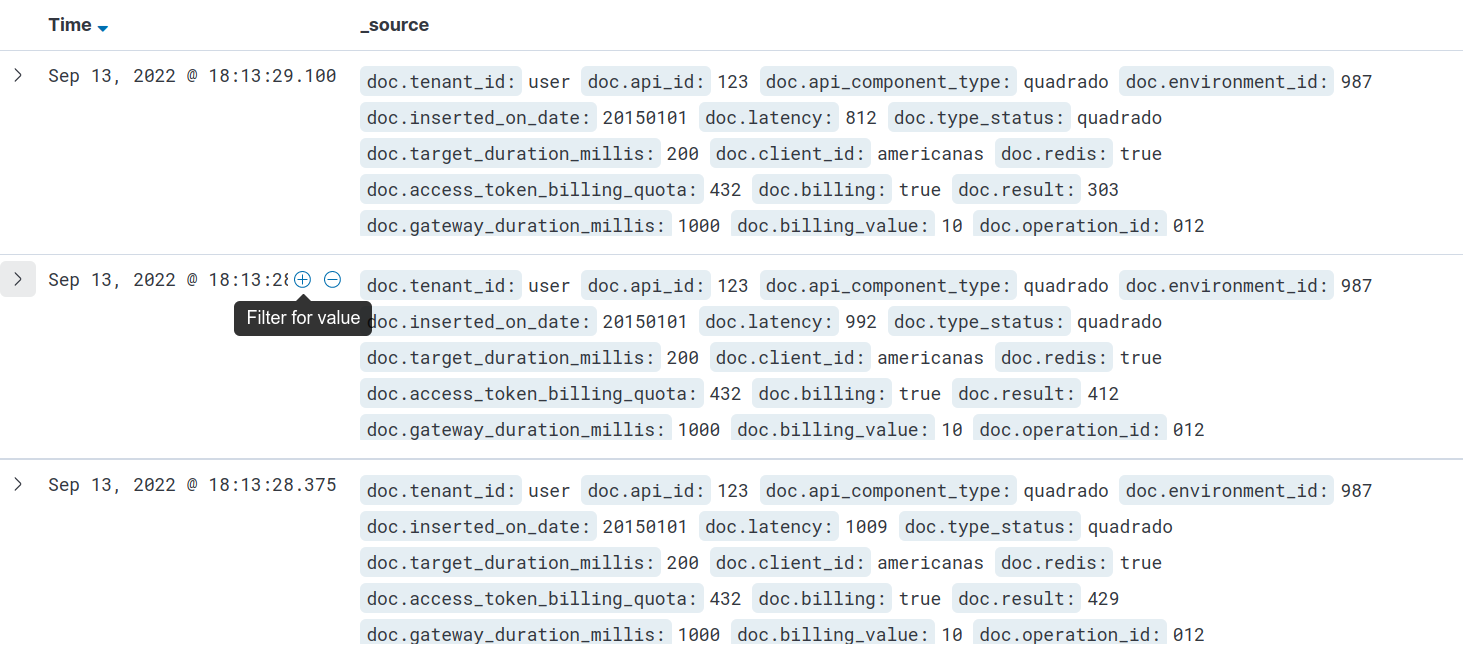
Just below the histogram you will find the documents.
By default, they are ordered from newest to oldest.
You can change this ordering by clicking the column header: 
To see more details, click the arrow to the left of the date, as shown below. All the fields and values will be displayed.
With the document expanded, go to the Table tab and hover the cursor over any field. The following options will be displayed:
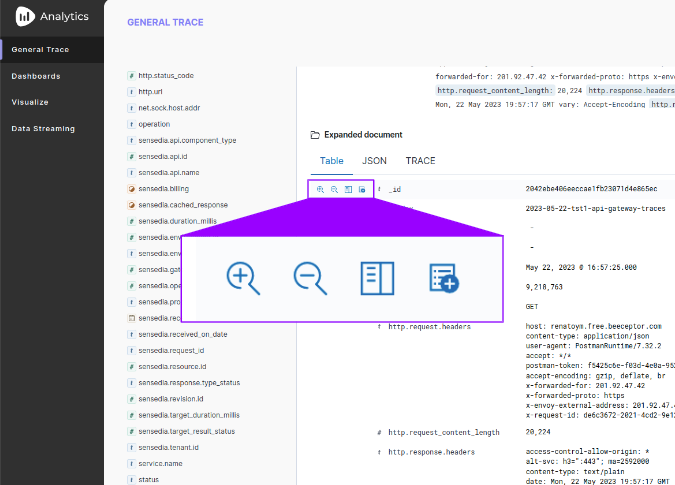
 Filter for value: adds the value of that field as search filter;
 Filter out value: removes the value from the search filter;
 Toggle column in a table: toggles the column of results, including that field as a column;
 Filter for field present: adds the field to the search filter.
Similarly, you can add or remove a date from the search result by clicking the options that appear when hovering the cursor on the desired date:
See more details about the organization and filters for your query results in the following video.
This list displays all fields that appear in your search result.
You may search for a specific field by typing its name in Search field names.
By clicking the field name in the list, you can see the most common values for that field.
To add a field to the search result, click the  that you see when positioning the cursor over the field.
See more details about the sidebar fields in the following video.
| For users who have upgraded from version 4.12.x.x or earlier to the current version: see the mapping of the fields that have changed. |
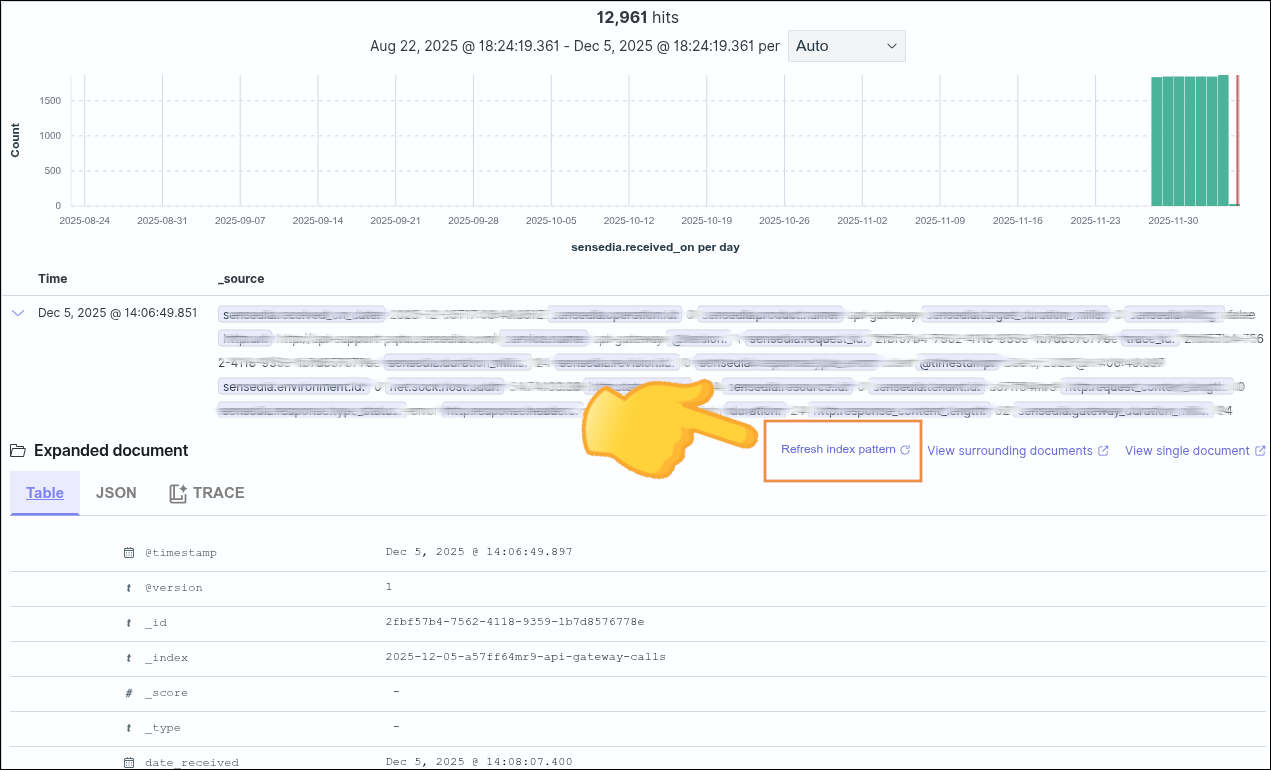
For new dynamic fields created by the Additional Info interceptor, if they haven’t been added to your index pattern, you can update the fields right in the General trace interface.
Follow the steps below to refresh the index pattern via the interface:
Click Refresh index pattern.
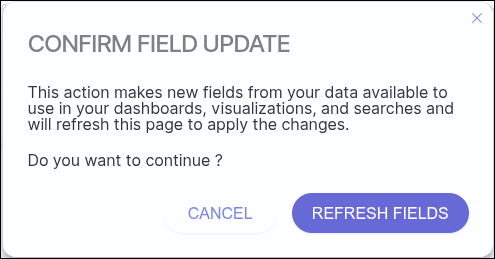
Confirm the action by clicking REFRESH FIELDS.
Wait a few seconds while the browser page is updated.
Check the new fields in the list on the left; they become available immediately for filters, aggregations, and visualizations.
|
AI Error Summary General Trace now features artificial intelligence to support failure analysis. With automatic summaries of errors found in the trace, it’s easier to understand what happened and much faster to resolve the issue. |
|
Follow the steps below to automatically generate, with Artificial Intelligence, a summary of the errors found.
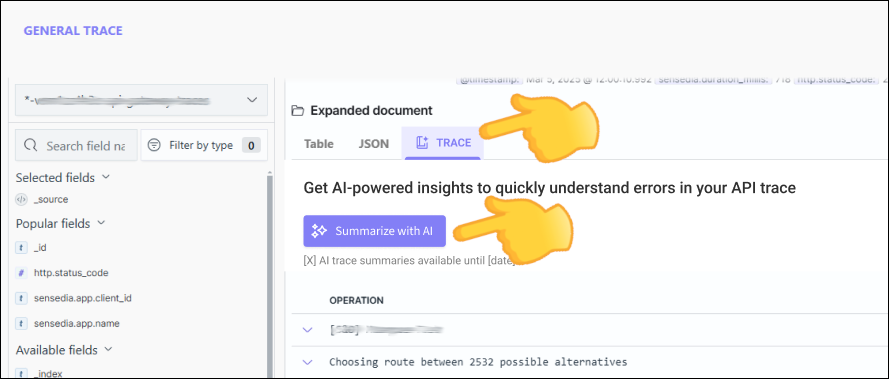
On the Analytics home screen, click the General trace card.
In the search results, click one of the documents to expand it and click the Trace tab.
Click the Summarize with AI button.
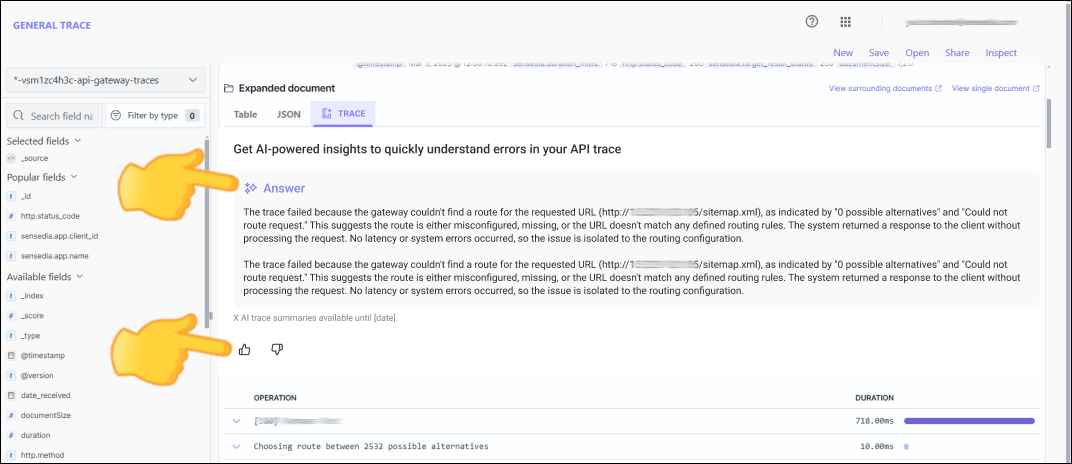
Wait a few seconds while the response is generated and check the summary for the reason the trace failed.
You can leave feedback by clicking  or
or  .
.
|
To access this feature, ensure the user is associated with a role that has the following permissions:
|
|
In the upper right corner of the screen, the following actions are available:
| To share the search result as an object, first save that search. You must have access to view the shared result. |
By clicking on Open in the actions menu, you have access to the Manage searches button. This option allows you to manage searches that you have saved in General Trace, Visualize and Dashboards.
Share your suggestions with us!
Click here and then [+ Submit idea]