Thanks for your feedback!
EDIT
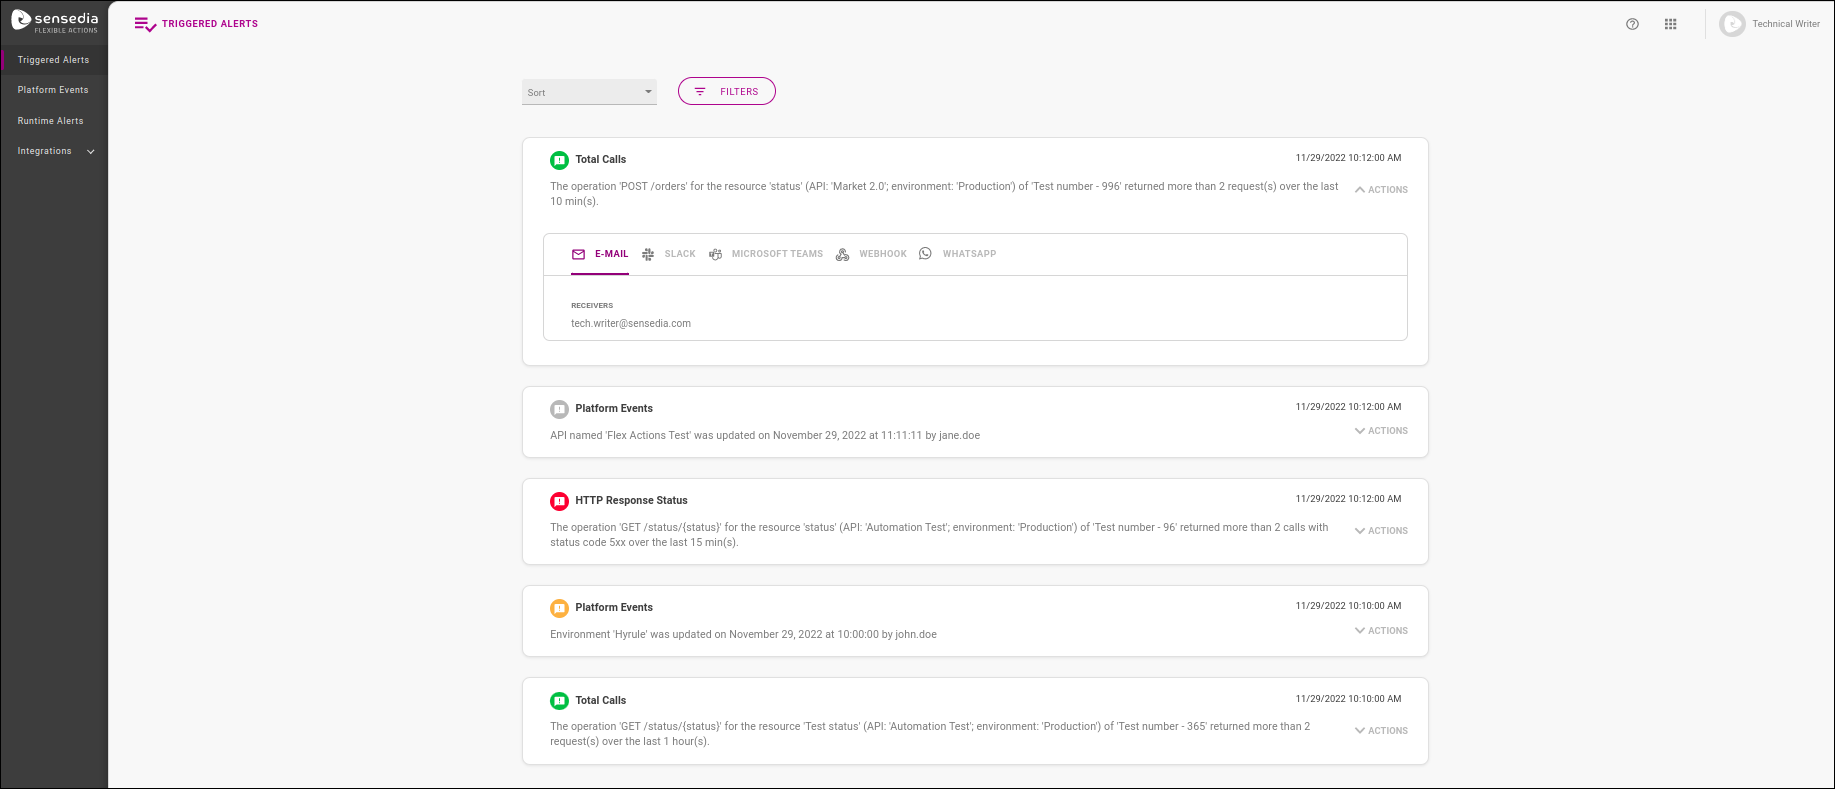
The Triggered Alerts screen shows the list of alerts triggered in the past seven days.
By default, the list of triggered alerts is sorted chronologically, from latest to oldest, and covers seven days of data, up to the current time. However, you can customise the results to find alerts more easily:
The field Sort lets you change the sorting order.
The button FILTERS displays optional fields to narrow down the list:
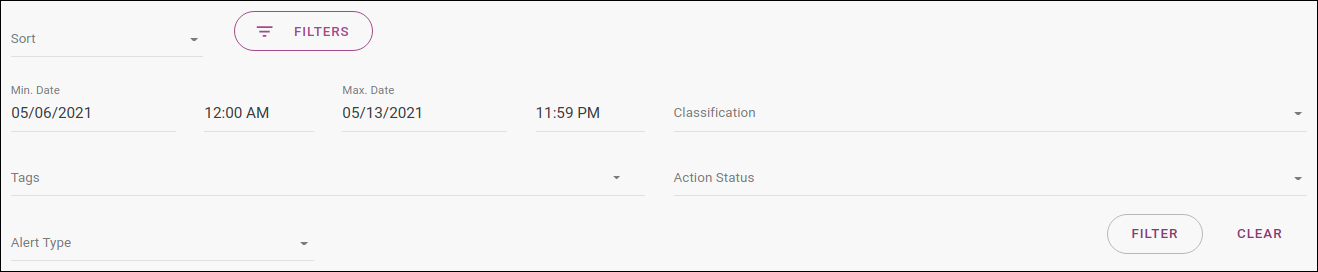
Min. Date and Max. Date let you select a datetime range that is more specific than the last seven days.
Classification filters by admonition (neutral, success, warning or critical).
Alert Type filters between Runtime Alerts and Platform Events.
If you choose Runtime Alerts, the field Notification Type is displayed, and it filters between the API performance parameters that can be monitored (Total Calls, Availability, Latency e HTTP Response Status).
If you choose Platform Events, the field Platform Object is displayed, and it filters between the objects that can be monitored (see the objects available here).
The button FILTER is used to generate a list with the filters selected. To go back to the default view, click on CLEAR.
The alerts triggered are displayed on cards, each of them exhibiting the notification type, an icon representing its classification, the time the alert was triggered and the message sent.
| The times at which the alerts were triggered follow your user’s preferred time zone, which is set on the API Manager. If you change your preferred time zone, the alert triggering times will be modified to reflect the new time zone. As for alert notification messages, when they involve times (such as when a Platform object was modified), these times are always in UTC±00:00, and are never modified. |
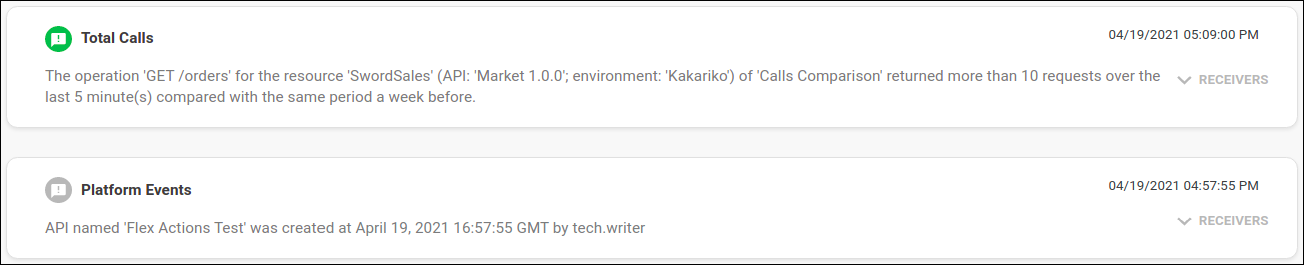
In the example below, the first card refers to an alert from the monitoring of the total number of GET requests to an API resource, while the second card refers to a Platform-event alert triggered when an environment was updated.
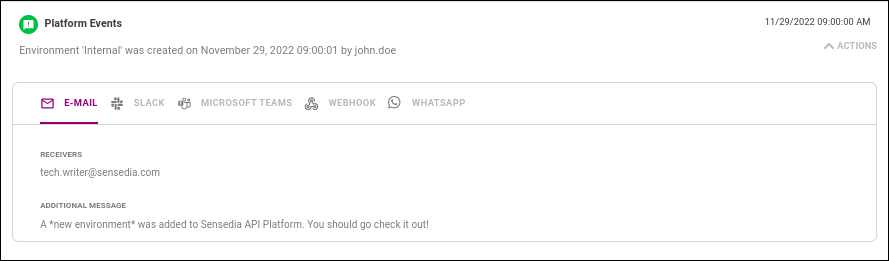
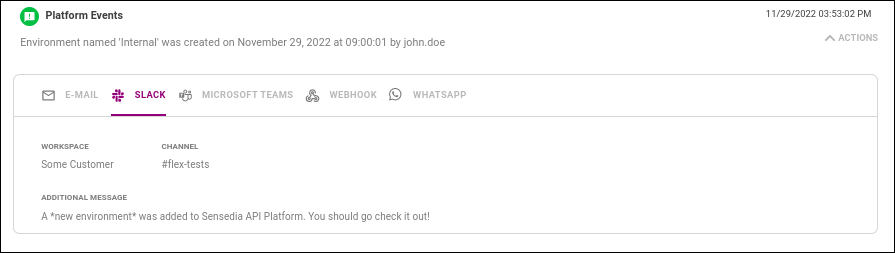
If you click a card’s RECEIVERS button, you can view the actions taken when the alert was triggered:
The EMAIL tab will display the email addresses the notification was sent to if this type of action was configured.
If a custom message has been added, it will be displayed in the ADDITIONAL MESSAGE field.
| Receivers must accept getting notifications by clicking on a confirmation link sent by email. If there are no confirmed receivers for a given notification, the EMAIL tab won’t show any email addresses. |
The SLACK tab will display the workspace and channel configured to receive notifications.
If a custom message has been added, it will be displayed in the ADDITIONAL MESSAGE field.
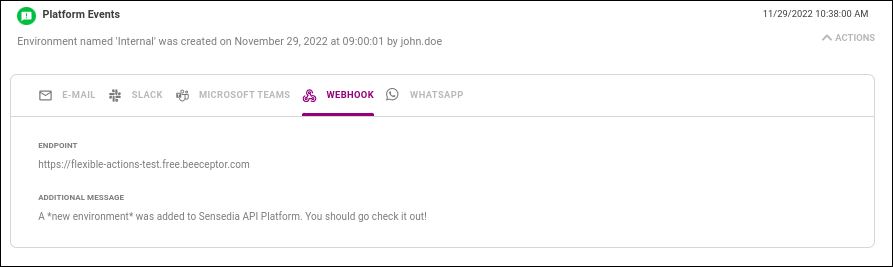
The WEBHOOK tab will display the endpoint notification requests were sent to if this type of action was configured.
If a custom message has been added, it will be displayed in the ADDITIONAL MESSAGE field.
Share your suggestions with us!
Click here and then [+ Submit idea]